Euro hovers below 1.1750 with all eyes on US CPI data
- EUR/USD retreats below 1.1750 after rejection at the 1.1790 area on Monday.
- Concerns about the resumption of hostilities in Iran are boosting the US Dollar on Tuesday.
- US CPI is expected to confirm that Iran's war boosted inflationary pressures in March.
The Euro (EUR) heads lower against the Dollar (USD) on Tuesday, trading right below 1.1750 at the time of writing, after another rejection at the 1.1790 area on Monday. Market concerns about the growing fragility of the US-Iran ceasefire are buoying the safe-haven US Dollar, which is drawing additional support from investors' caution ahead of the US Consumer Price Index (CPI) release.
Market sentiment soured on Tuesday following comments by US President Donald Trump affirming that the US-Iran ceasefire is on “life support”, and reports by the CNN news channel, citing some of his aides, stating that the US president is frustrated with the attitude of Iranian authorities and has brought the possibility of resuming combat operations back to the table.
In the US session, however, the highlight of the day will be the US Consumer Price Index (CPI) release. Consumer inflation is expected to have accelerated to a 3.7% yearly rate in April, its highest level since September 2023, confirming the inflationary impact of the Middle East war. Core inflation is seen rising to 2.7% year-on-year from 2.6% in March, with USD risk skewed to the upside, as higher-than-expected CPI figures might prompt more Federal Reserve Policymakers to jump on the hawkish side.
In the Eurozone, the ZEW Economic Sentiment Index released earlier on Tuesday revealed that institutional investors’ feelings about the German economy improved to -10.2 in May from -17.2 in April, against expectations of further deterioration, to -19.8. The sentiment about the current economic situation, however, has dropped to five-month lows at -77.8, from -73.7 in April, below the -77.5 market consensus. The impact of these figures on the Euro was marginal.
Technical analysis: Next support is at the 1.1725 area
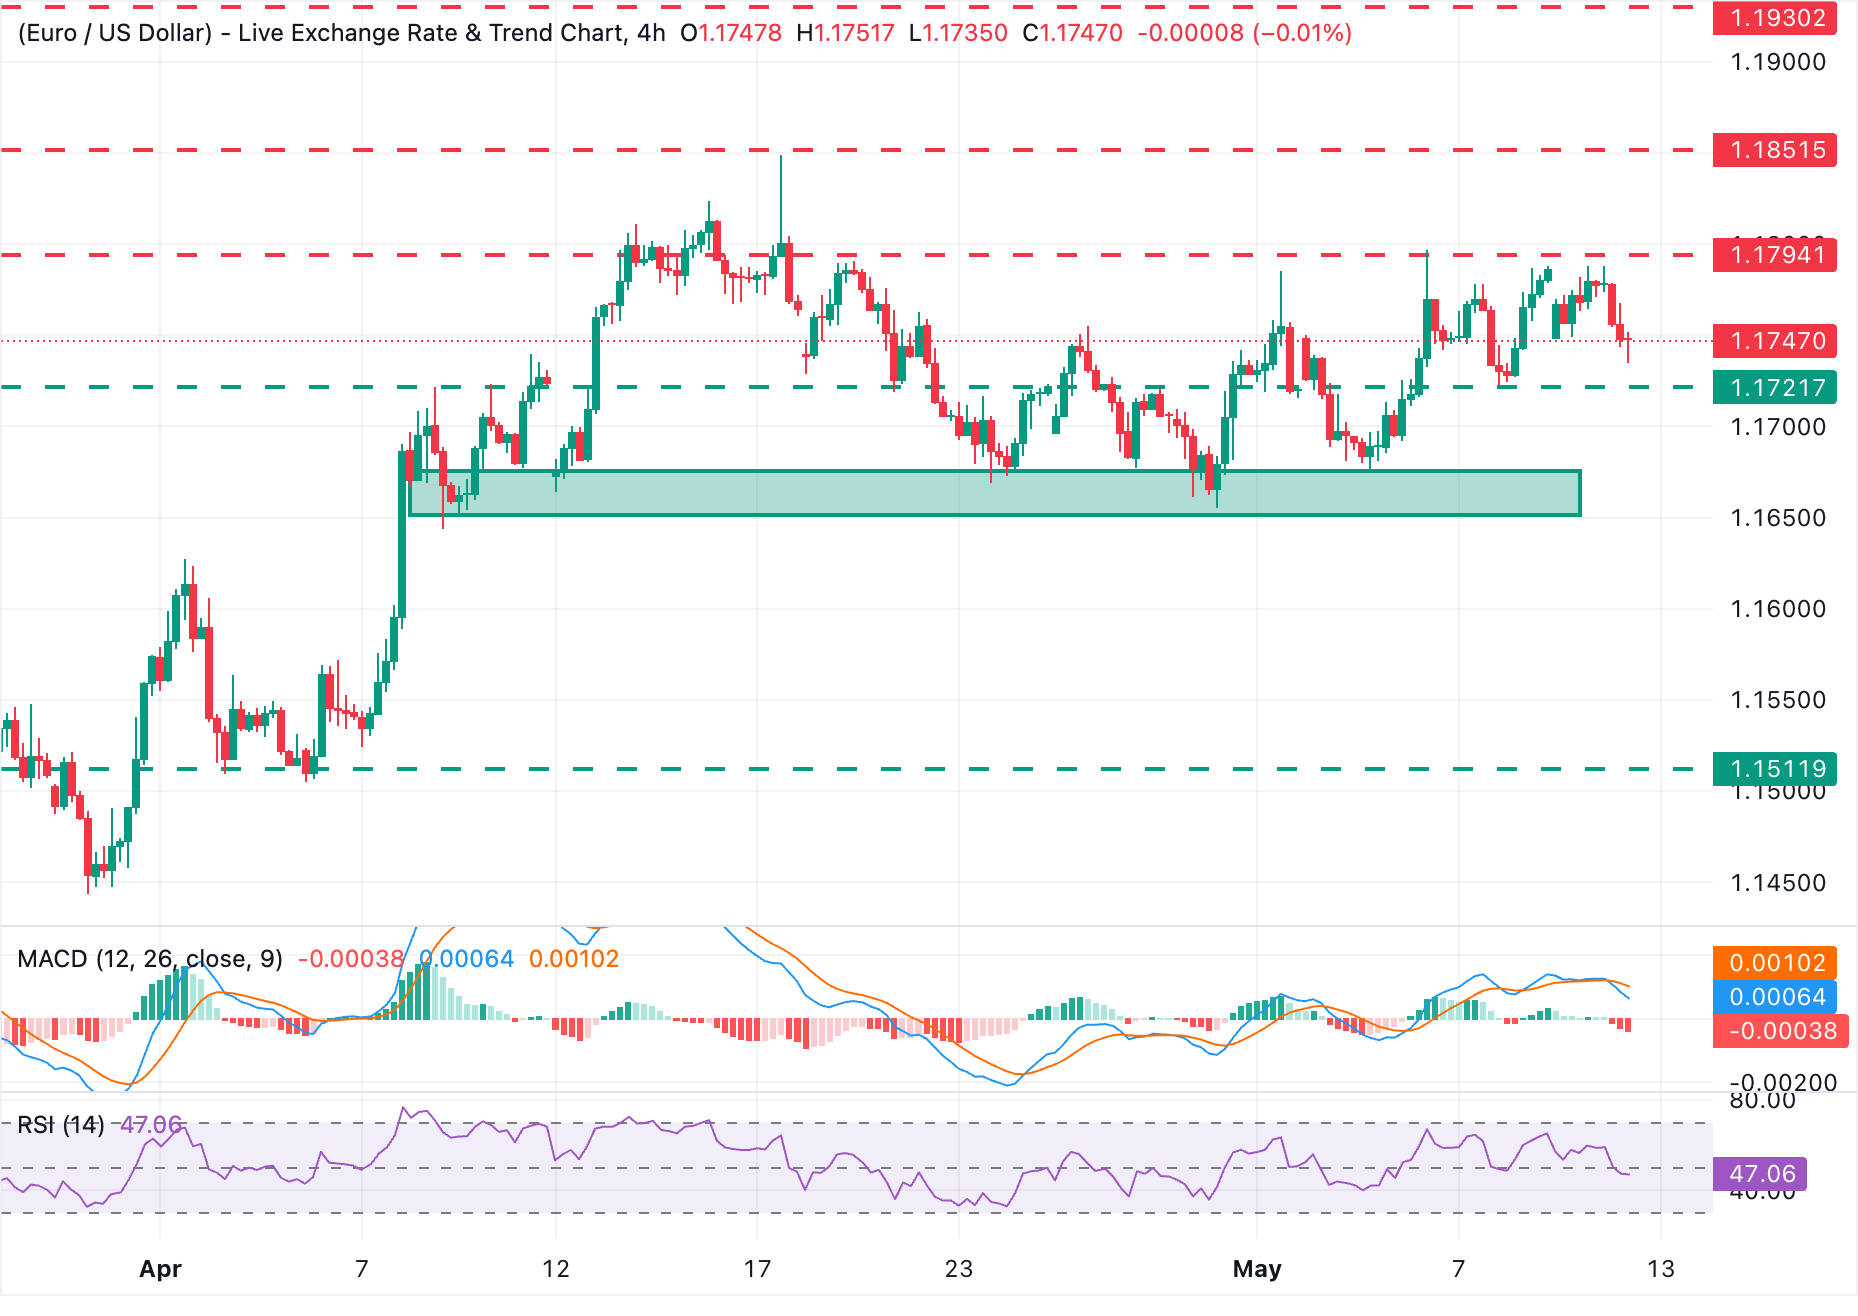
EUR/USD's technical picture shows bearish momentum building up slowly on the 4-hour chart. The Relative Strength Index (RSI) around 47 hints at fading bullish pressure, while the Moving Average Convergence Divergence (MACD) has slipped marginally into negative territory, suggesting that upside momentum is waning.
On the downside, the first notable support comes in at Friday's low, about 1.1725, ahead of a key support area between 1.1645 and 1.1675, which halted sellers several times in April. On the topside, the resistance area between 1.1790 and 1.1800 (May 1, 6, and 8 highs) is expected to test upside attempts ahead of April's peak, at the 1.1850 area.
(The technical analysis of this story was written with the help of an AI tool.)
Economic Indicator
Consumer Price Index (YoY)
Inflationary or deflationary tendencies are measured by periodically summing the prices of a basket of representative goods and services and presenting the data as The Consumer Price Index (CPI). CPI data is compiled on a monthly basis and released by the US Department of Labor Statistics. The YoY reading compares the prices of goods in the reference month to the same month a year earlier.The CPI is a key indicator to measure inflation and changes in purchasing trends. Generally speaking, a high reading is seen as bullish for the US Dollar (USD), while a low reading is seen as bearish.
Read more.Next release: Tue May 12, 2026 12:30
Frequency: Monthly
Consensus: 3.7%
Previous: 3.3%
Source: US Bureau of Labor Statistics
The US Federal Reserve (Fed) has a dual mandate of maintaining price stability and maximum employment. According to such mandate, inflation should be at around 2% YoY and has become the weakest pillar of the central bank’s directive ever since the world suffered a pandemic, which extends to these days. Price pressures keep rising amid supply-chain issues and bottlenecks, with the Consumer Price Index (CPI) hanging at multi-decade highs. The Fed has already taken measures to tame inflation and is expected to maintain an aggressive stance in the foreseeable future.
Economic Indicator
Consumer Price Index ex Food & Energy (YoY)
Inflationary or deflationary tendencies are measured by periodically summing the prices of a basket of representative goods and services and presenting the data as the Consumer Price Index (CPI). CPI data is compiled on a monthly basis and released by the US Department of Labor Statistics. The YoY reading compares the prices of goods in the reference month to the same month a year earlier. The CPI Ex Food & Energy excludes the so-called more volatile food and energy components to give a more accurate measurement of price pressures. Generally speaking, a high reading is bullish for the US Dollar (USD), while a low reading is seen as bearish.
Read more.Next release: Tue May 12, 2026 12:30
Frequency: Monthly
Consensus: 2.7%
Previous: 2.6%
Source: US Bureau of Labor Statistics
The US Federal Reserve has a dual mandate of maintaining price stability and maximum employment. According to such mandate, inflation should be at around 2% YoY and has become the weakest pillar of the central bank’s directive ever since the world suffered a pandemic, which extends to these days. Price pressures keep rising amid supply-chain issues and bottlenecks, with the Consumer Price Index (CPI) hanging at multi-decade highs. The Fed has already taken measures to tame inflation and is expected to maintain an aggressive stance in the foreseeable future.