Volatility Indicators – An Edge Amind Uncertainty
June 04, 2022


You either love or hate volatility, but that depends on whether you’re trading or investing.
- Volatility indicators can help you gauge where price is relative to a given average
- These indicators can also help you gauge the current volatility cycle
- Timing volatility can be just as difficult as timing the market, so be careful
Short-term traders need volatility, and it doesn’t matter whether it’s up or down; positive or negative. They’ll trade either way. In contrast, investors typically dread volatility, because in their language, volatility means negative or downward volatility. And that means losses.
Whether you’re a trader or investor, there’s a way to read the volatility situation and anticipate what a market or instrument might do. That’s what volatility indicators are for: to help you interpret the current volatility environment in order to make smarter trading decisions.
Although there are plenty of them out there, we’ve selected two that might help you find an “edge” when navigating a given market amid directional uncertainty.
Bollinger Bands – Is the Market Getting Ahead of Itself or Poised to Jump?
You see a market moving up and down. But how might you assess whether it’s moving too far ahead of itself (up or down) or whether it’s not moving far enough in either direction? You compare it to an average.
Let’s say the average is a 20-day simple moving average, like the one below.
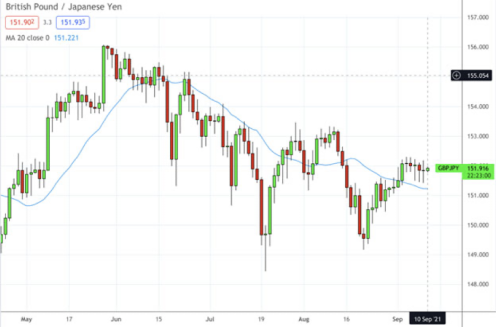
Okay, what now? How might you anticipate the price pivots or reversals? What if you wanted to trade those smaller swings—how might you anticipate their potential reversals?
One solution would be to use Bollinger Bands.
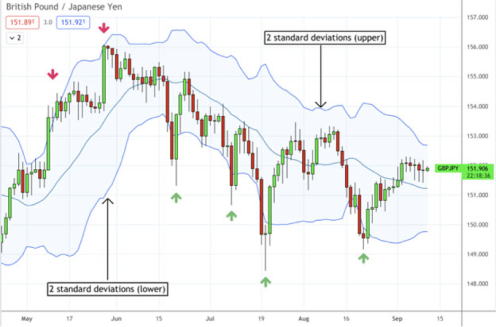
Notice how price tends to reverse (however long or short the duration) after closing above or below the 2nd standard deviation in either direction. Think of these bands as “hypothetical” upper and lower price thresholds.
Don’t know what a standard deviation is? It’s a statistical calculation that tells you how far something has moved from the mean (or average). The higher the deviation, the more likely a close beyond it might revert back to the mean or average price, in theory at least. And with Bollinger Bands, most trading platforms allow you to plot 1, 2, and 3 standard deviations from the moving average.
Here are a few ways to interpret Bollinger Bands:
- The higher the standard deviation, the greater the volatility.
- When price goes beyond the second standard deviation, it’s likely to revert to the mean, though there’s no guarantee, as price can even exceed the 3rd standard deviation if there’s sufficient momentum to drive it.
- The upper band can signal “overbought” while the lower band can indicate “oversold.”
- Important trader tip: If price is barely moving and the bands are narrow, the asset may be due for an explosive move, up or down, as in the image below.
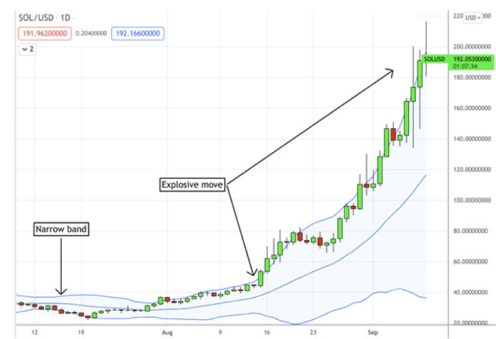
There are more ways to interpret and use Bollinger Bands, but the insights we just gave you can get you off and running to a good start.
Average True Range – Is it Always This Shaky in Here?
You open your chart to a tradable market and begin asking yourself: Is this as volatile as it usually gets…when did volatility start increasing or decreasing…what’s its average volatility profile?
The quick solution to your questions is to be found in the Average True Range (ATR) indicator. The ATR takes the average “daily” range over a given “lookback” period. In the example below, it’s measuring the average range of daily movements across a 14-day period.
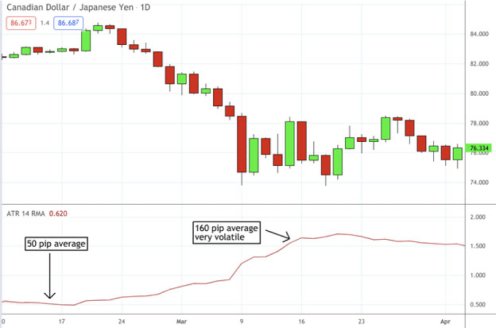
Note that the 14-day ATR, which started at 50 pips and ended over 150 pips, is a 200% increase in volatility. Is that tradable? It depends on your risk tolerance and trading strategy.
Perhaps you can use it to tell you when to trade the asset. Perhaps it can help you anticipate when to implement a short-volatility (e.g., condor spread) or long-volatility (e.g., straddle) options spread. How you use the ATR is up to you; there are plenty of ways to use it.
Positioning Yourself for Increasing or Decreasing Volatility
If a market is liquidly traded, it usually fluctuates not only in price but in volatility. It’s hard to find a liquidly traded market that’s either always super volatile or always tame.
So, depending on your trading style and risk tolerance, your smartest move might be to anticipate the coming volatility environment. If you prefer trading a volatile move, then you might wait for an instrument of choice to enter a relatively low-volatility phase, hoping to catch an explosive move.
On the other hand, if you prefer a less volatile scenario, then you might want to wait for your instrument to settle down if it happens to be on the turbulent end of the volatility environment.
Just remember, timing volatility can be just as difficult as timing the market. So be careful. More importantly, you can use these indicators to give you a “sitrep” (situation report) on the current volatility environment: where price is in relation to the average, and whether it’s on the high or low side of the volatility cycle. Good luck, and trade wisely!