Forex Charts
If you’re looking to place a trade on a currency pair, say, the EUR/USD, it probably won’t help much if all you knew was the current exchange rate. Let’s suppose the pair is trading at 1.1700 euro per dollar. In most circumstances, this information would be the least bit useful.
So what do you need to know—where it traded yesterday, a week ago, or just in the last few minutes? Do you need to see support and resistance levels, or even chart patterns, or do you need to see the overall trend with the least amount of “noise” as possible? Do you need to see closing levels only, or might it help to see the opening price, highs, and lows?
Depending on the kind of price information you need, selecting the right price chart can be critical. We’re going to talk about only two basic charts that most investors and traders use: the line chart and the candlestick chart. We’re going to pass on the bar chart, as candlesticks are similar enough but contain more information so as to be a kind of “evolved” bar chart of sorts.
The Line Chart
A line chart is simply a continuous line that connects all of a forex pair’s closing prices.
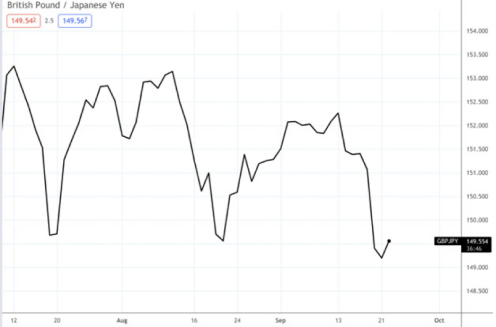
If all you need to see is the general trend of a currency pair, then you need no more information than the continuous closing prices this chart illustrates. Line charts also allow you to see price channels and other chart pattern formations that may be useful to your technical analysis.
But what if you need to see support and resistance formed not by closing prices but by session lows and highs? And what if you wanted to know which days marked advances versus declines? In these cases, line charts won’t be very helpful.
The Candlestick Chart
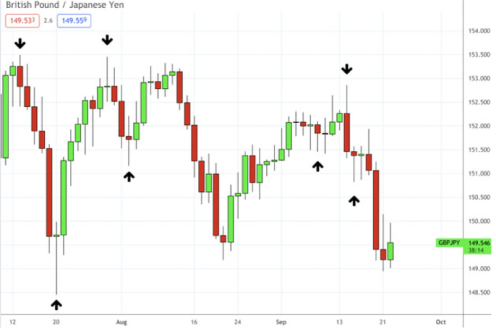
The difference between the candlestick and line chart should be quite pronounced. In this GBPJPY chart above, the advancing sessions are indicated by the green candles and the down days are in red. You can clearly see the opening, high, low, and close of the day.
Similar to the line chart, perhaps even more so, you can clearly see chart patterns, but based on high and lows rather than closing prices.
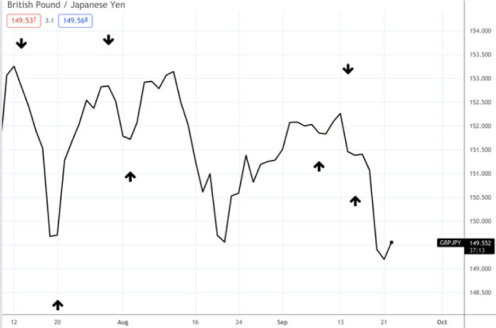
This last point is important. What are you missing if you can’t see lows and highs? Look closely at the arrows above. Note that the lows and highs reveal critical support and resistance levels that may be important for your market entries and exits.
If you compare these areas to the line chart below, you’ll see how the lines completely miss support and resistance altogether.
The Bottom Line
When it comes to market data, seeing too little or seeing too much can prevent you from making a sound and efficient decision. So, when choosing which chart to follow, base your choice on the level of information you need to get a lay of the price landscape.
Indicators can also help you decide which price chart to use, though most lean heavily toward the use of candlestick (or bar) charts rather than line charts. Again, you don’t want to see too little or too much, but just enough to be able to assess and trade your market with adequate information.