GBP/JPY Price Forecast: Pound hesitates ahead of the 204.00 level
- The Pound retraces previous losses against the Yen, but remains capped below 204.00.
- The long wicks on the daily candles reflect a hesitant market.
- Investors' concerns about the UK's public finances are weighing on the Pound.
The Pound appreciates moderately against the Japanese Yen on Monday, reverting some of Friday’s lows and returning to the upper range of the 203-00s. The long wicks on the daily chart, however, reveal hesitation ahead of a significant resistance area, between 204.05 and 204.25.
The Sterling is showing strength on choppy markets on Monday, but concerns about the UK’s public finances remain alive, and are likely to keep the pair’s upside attempts limited. News that Chancellor Rachel Reeves will step back on her plans to raise the income tax in the November 26 budget has raised concerns about the government’s chances of meeting their fiscal targets.
Technical analysis: GBP/JPY key resistance is at 204.25
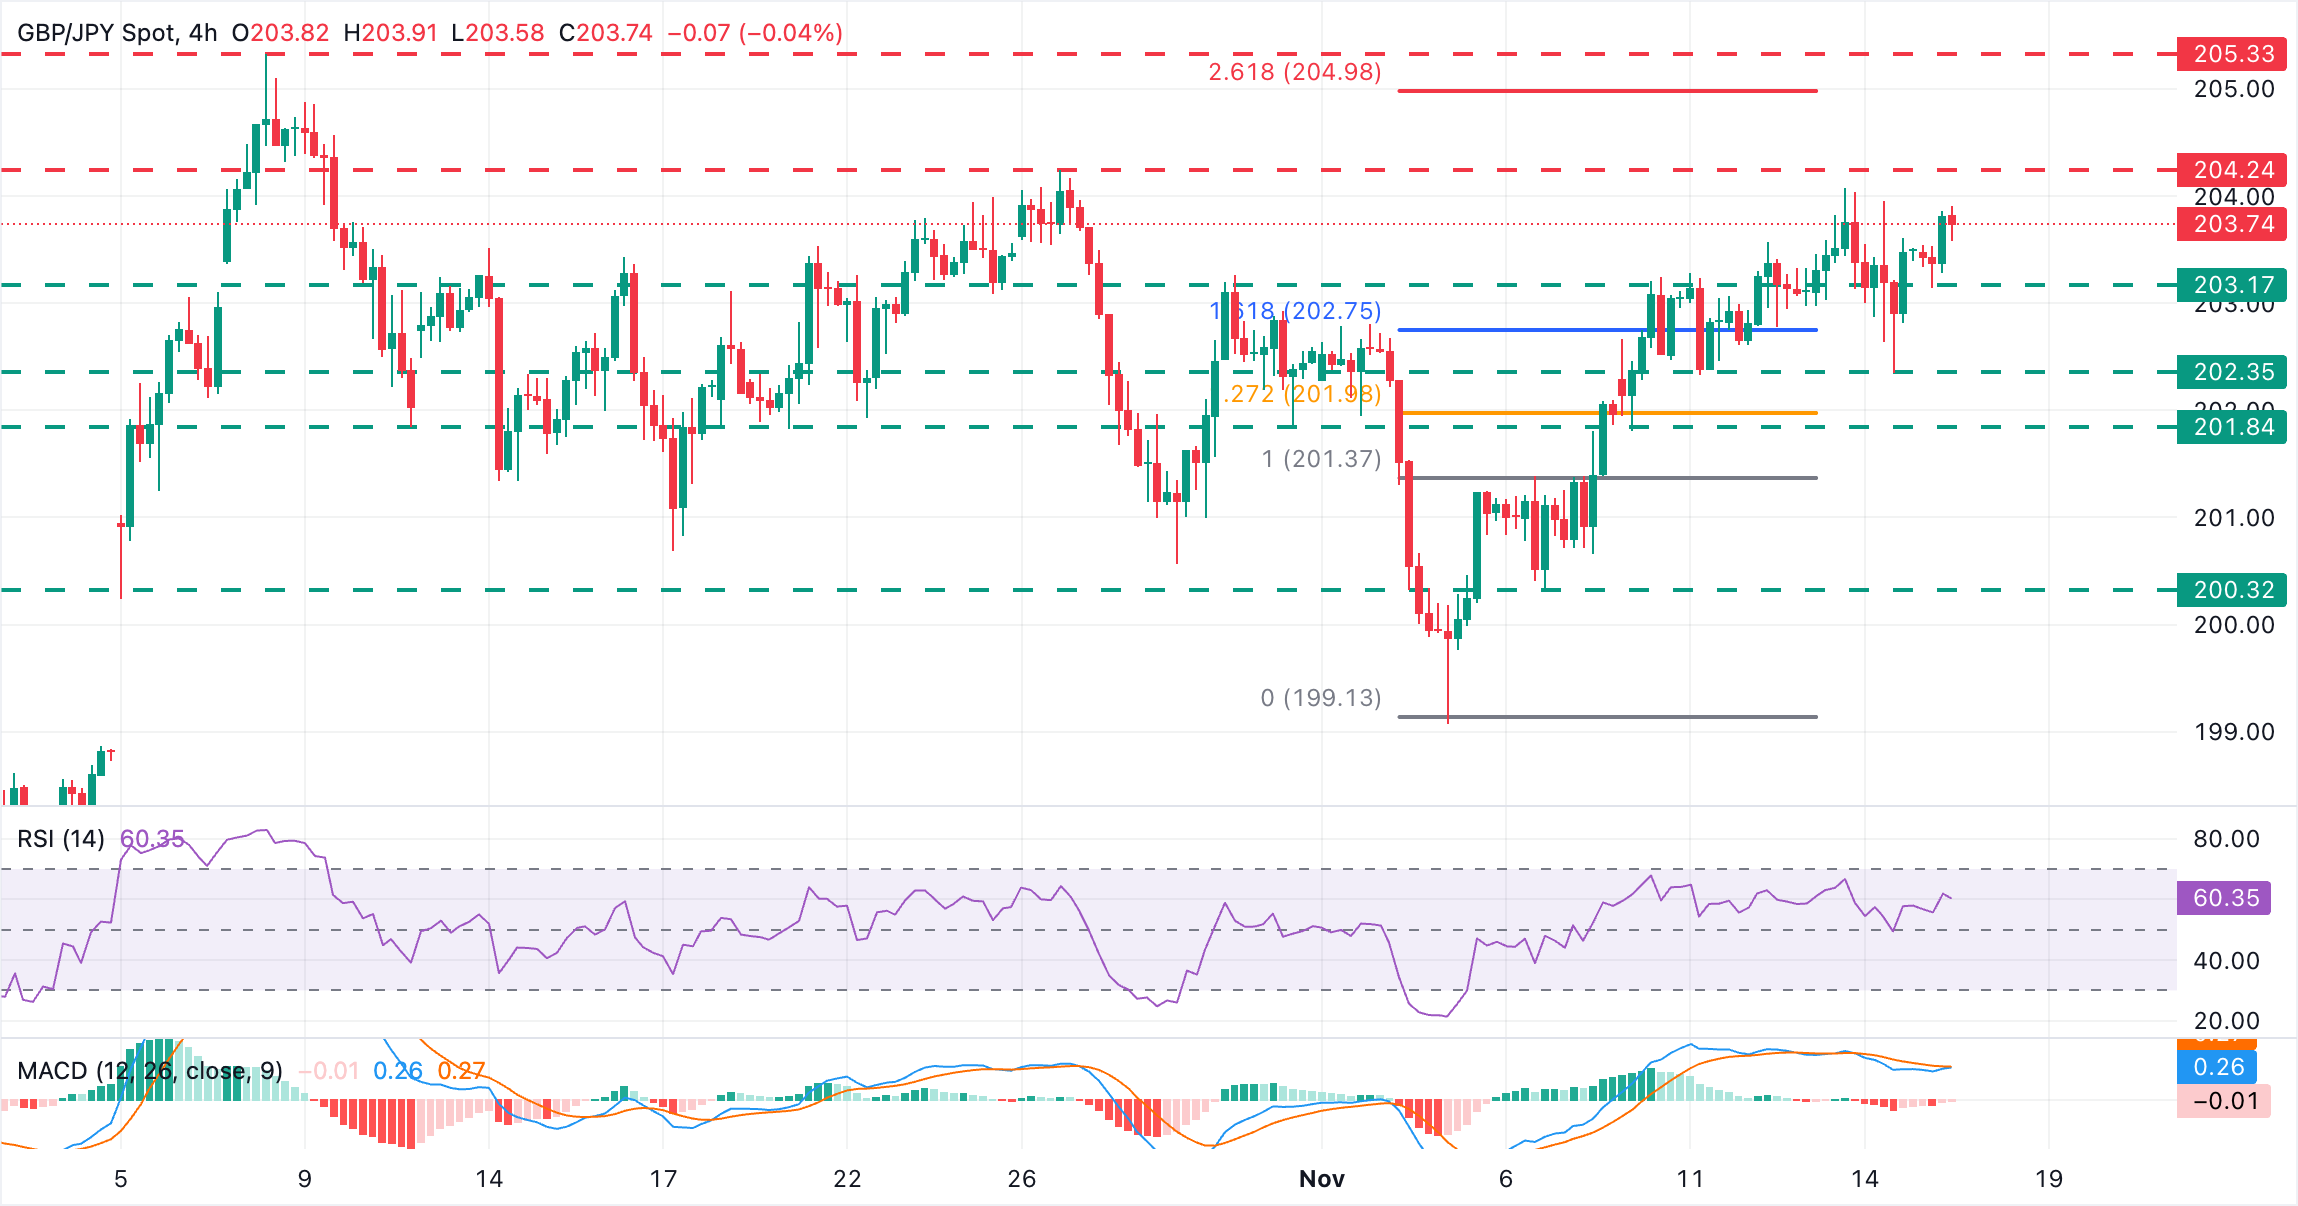
The technical picture remains positive. The Relative Strength Index (RSI) in 4-hour charts is steady at levels above 50. Still, the Moving Average Convergence Divergence is showing a lack of real momentum, with price action approaching a key resistance area at $204.25 (October 27 high)
Bulls are likely to struggle at that level. Further up, the 261.8% Fibonacci extension of the November 5 to 6 rally is at 205.00, and the year-to-date high, at 205.30 (October 8 high).
To the downside, immediate support is at the intra-day low near 203.15. Below here, the October 11 and 14 lows near 202.35 are likely to challenge bears. If these levels are broken, the next target would be the November 10 low, near 201.85 might test bearish momentum before the November 6 and 7 lows in the area between 200.30 and 200.60.
Pound Sterling Price Today
The table below shows the percentage change of British Pound (GBP) against listed major currencies today. British Pound was the strongest against the Australian Dollar.
| USD | EUR | GBP | JPY | CAD | AUD | NZD | CHF | |
|---|---|---|---|---|---|---|---|---|
| USD | 0.17% | -0.04% | 0.12% | -0.01% | 0.21% | 0.11% | 0.03% | |
| EUR | -0.17% | -0.22% | -0.04% | -0.18% | 0.04% | -0.06% | -0.13% | |
| GBP | 0.04% | 0.22% | 0.16% | 0.02% | 0.25% | 0.15% | 0.07% | |
| JPY | -0.12% | 0.04% | -0.16% | -0.14% | 0.09% | -0.01% | -0.09% | |
| CAD | 0.01% | 0.18% | -0.02% | 0.14% | 0.23% | 0.12% | 0.05% | |
| AUD | -0.21% | -0.04% | -0.25% | -0.09% | -0.23% | -0.11% | -0.18% | |
| NZD | -0.11% | 0.06% | -0.15% | 0.01% | -0.12% | 0.11% | -0.07% | |
| CHF | -0.03% | 0.13% | -0.07% | 0.09% | -0.05% | 0.18% | 0.07% |
The heat map shows percentage changes of major currencies against each other. The base currency is picked from the left column, while the quote currency is picked from the top row. For example, if you pick the British Pound from the left column and move along the horizontal line to the US Dollar, the percentage change displayed in the box will represent GBP (base)/USD (quote).