EUR/USD jumps to two-week highs with US Manufacturing data on focus
- The Euro hits fresh two-week highs above 1.1630, amid broad-based USD weakness.
- Eurozone manufacturing activity contracted beyond expectations in November.
- The US Dollar remains on its back foot amid hopes of Fed interest rate cuts.
EUR/USD maintains a firm tone and extends gains for the sixth consecutive day on Monday, trading at two-week highs beyond 1.1630 at the time of writing. A downside correction of November's Eurozone Purchasing Managers' Index (PMI) has failed to halt the Euro (EUR), and the focus now turns to US manufacturing activity data.
The US Dollar (USD) remains on the defensive, with investors bracing for a US Federal Reserve (Fed) interest rate cut next week. Beyond that, US President Donald Trump might announce the White House economic adviser, Kevin Hassett, as the central bank's next chairman, according to Reuters. Hasset is a vocal dove and is expected to bring Trump's agenda of a loose monetary policy.
Later on Monday, Fed Chairman Jerome Powell will participate in a panel discussion in Stanford, California, yet the highlight of the day will be the November ISM Manufacturing PMI release, due at 15:00 GMT.
Euro Price Today
The table below shows the percentage change of Euro (EUR) against listed major currencies today. Euro was the strongest against the New Zealand Dollar.
| USD | EUR | GBP | JPY | CAD | AUD | NZD | CHF | |
|---|---|---|---|---|---|---|---|---|
| USD | -0.29% | -0.05% | -0.79% | -0.05% | -0.04% | 0.03% | -0.16% | |
| EUR | 0.29% | 0.24% | -0.43% | 0.24% | 0.25% | 0.31% | 0.15% | |
| GBP | 0.05% | -0.24% | -0.68% | -0.00% | 0.02% | 0.08% | -0.09% | |
| JPY | 0.79% | 0.43% | 0.68% | 0.68% | 0.69% | 0.75% | 0.58% | |
| CAD | 0.05% | -0.24% | 0.00% | -0.68% | 0.00% | 0.07% | -0.09% | |
| AUD | 0.04% | -0.25% | -0.02% | -0.69% | -0.01% | 0.06% | -0.10% | |
| NZD | -0.03% | -0.31% | -0.08% | -0.75% | -0.07% | -0.06% | -0.16% | |
| CHF | 0.16% | -0.15% | 0.09% | -0.58% | 0.09% | 0.10% | 0.16% |
The heat map shows percentage changes of major currencies against each other. The base currency is picked from the left column, while the quote currency is picked from the top row. For example, if you pick the Euro from the left column and move along the horizontal line to the US Dollar, the percentage change displayed in the box will represent EUR (base)/USD (quote).
Euro extends its recovery unfazed by the Eurozone's weak manufacturing activity
- Eurozone's final HCOB Manufacturing PMI revealed that the sector's activity contracted to a five-month low of 49.6 in November, beyond the 49.7 reading seen at the preliminary estimation and down from 50.0 in October.
- The Euro, however, remains bid, mostly due to USD weakness. Growing bets that the Fed is cutting its benchmark interest rate by 25 basis points next week and, a few more times next year, are keeping investors away from the US Dollar
- Fed Chairman Jerome Powell is expected to participate in a panel at the Hoover Institute in a memorial lecture about George P. Schulz and Economic Policy, although he is not expected to talk about monetary policy because the Fed is in its blackout period ahead of the December meeting
- Later on, the focus will shift to November's US ISM PMI, which is expected to have eased to 48.6 from 48.7 in October. The Prices Paid sub-index is seen growing to 59.6 from 50.0 in October. The employment gauge is likely to be observed with particular interest.
- The economic calendar is packed with data this week, with Eurozone Harmonized Index of Consumer Prices (HICP) on Tuesday, Services PMIs from Eurozone and the US on Wednesday, together with the ADP Employment Change report, and the US Personal Consumption Expenditures (PCE) Prices Index on Friday.
Technical Analysis: EUR/USD pierces the 1.1615 resistance area
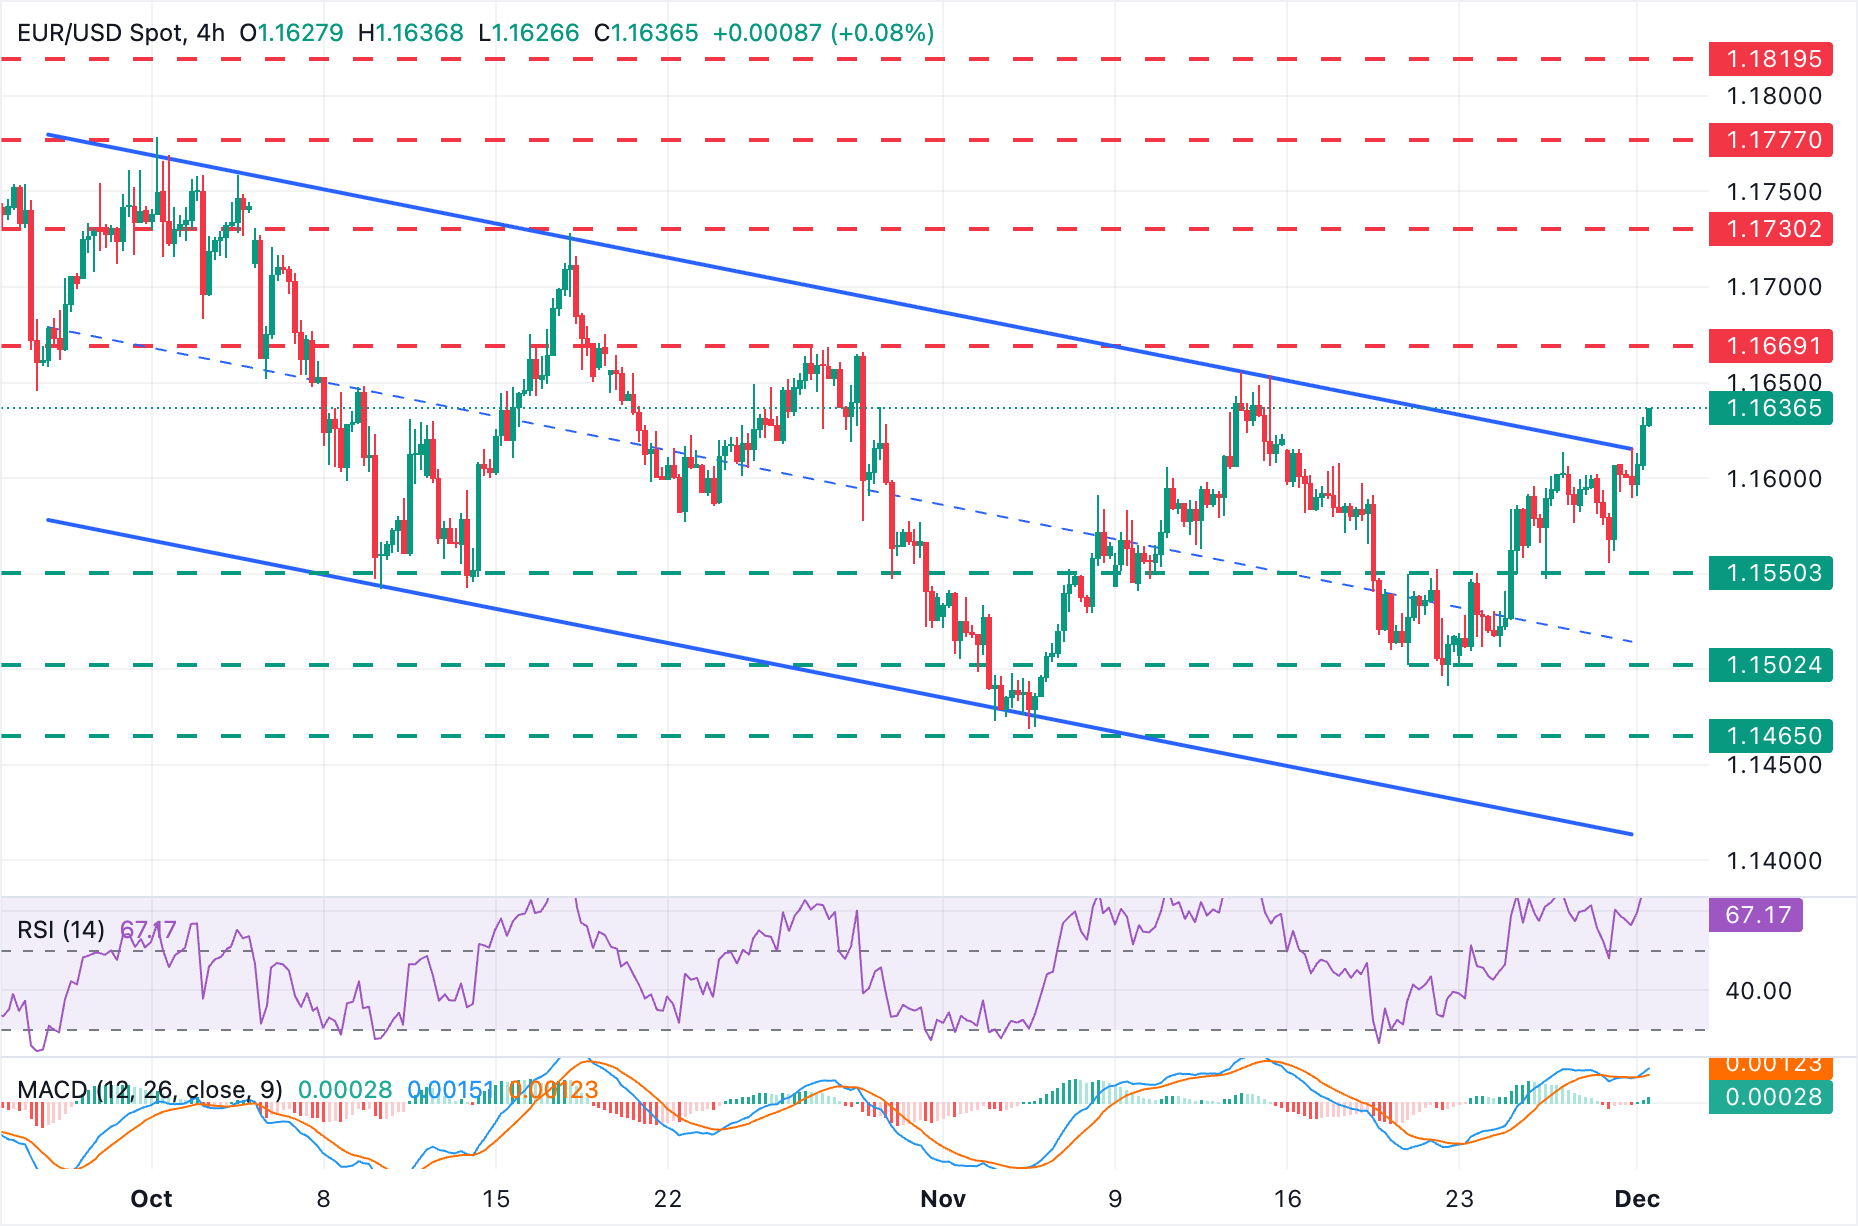
The US Dollar's weakness is giving EUR/USD bulls confidence to test the top of the descending channel from early October highs, at 1.1615. Technical indicators are mixed; the 4-hour Relative Strength Index (RSI) remains in bullish territory near the 60.0 level, but the Moving Average Convergence Divergence (MACD) indicator is hovering around the signal line, which points to a fading bullish momentum.
A clear confirmation above the mentioned 1.1615 would signal a trend shift and bring the 1.1660 - 1.1670 area (October 28, 29, November 13, 14 highs) into focus. Further up, the next target is the October 17 high, right below 1.1730.
Immediate support remains at 1.1550 (around November 21 and 24 highs). Further down, the 1.1500 psychological level might hold bears ahead of the November 5 lows, near 1.1470.
Economic Indicator
ISM Manufacturing PMI
The Institute for Supply Management (ISM) Manufacturing Purchasing Managers Index (PMI), released on a monthly basis, is a leading indicator gauging business activity in the US manufacturing sector. The indicator is obtained from a survey of manufacturing supply executives based on information they have collected within their respective organizations. Survey responses reflect the change, if any, in the current month compared to the previous month. A reading above 50 indicates that the manufacturing economy is generally expanding, a bullish sign for the US Dollar (USD). A reading below 50 signals that factory activity is generally declining, which is seen as bearish for USD.
Read more.Next release: Mon Dec 01, 2025 15:00
Frequency: Monthly
Consensus: 48.6
Previous: 48.7
Source: Institute for Supply Management
The Institute for Supply Management’s (ISM) Manufacturing Purchasing Managers Index (PMI) provides a reliable outlook on the state of the US manufacturing sector. A reading above 50 suggests that the business activity expanded during the survey period and vice versa. PMIs are considered to be leading indicators and could signal a shift in the economic cycle. Stronger-than-expected prints usually have a positive impact on the USD. In addition to the headline PMI, the Employment Index and the Prices Paid Index numbers are watched closely as they shine a light on the labour market and inflation.
Economic Indicator
ISM Manufacturing Prices Paid
The Institute for Supply Management (ISM) Manufacturing Index shows business conditions in the US manufacturing sector, taking into account expectations for future production, new orders, inventories, employment and deliveries. It is a significant indicator of the overall economic condition in US. The ISM Prices Paid represents business sentiment regarding future inflation. A high reading is seen as positive for the USD, while a low reading is seen as negative.
Read more.Next release: Mon Dec 01, 2025 15:00
Frequency: Monthly
Consensus: 59.5
Previous: 58
Source: Institute for Supply Management