GBP/USD rises as Iran talk hopes weigh on US Dollar demand
- GBP/USD appreciates on ceasefire hopes and Iran talks.
- Weak US sentiment data added pressure on the Greenback.
- UK Retail Sales beat forecasts, helping the Sterling stay supported.
GBP/USD advances on Friday as improved risk appetite weighed on the US Dollar’s (USD) safety appeal amid growing speculation that a second round of talks between the US and Iran looms. A three-week extension of the ceasefire between Israel and Lebanon added to traders’ optimism.
Sterling firms as softer US sentiment and solid UK sales help
The GBP/USD pair trades at 1.3498, up 0.24% after bouncing off daily lows of 1.3453, amid renewed hopes for an end to the conflict between the US and Iran.
Newswires reported that Iran’s Foreign Minister Abbas Araghchi will present a proposal for talks with the US, according to Pakistani sources. He and a small delegation are expected to meet with Pakistani mediators to discuss a potential resumption of negotiations with Washington.
Data in the US revealed that households are becoming pessimistic about the economy. The University of Michigan (UoM) Consumer Sentiment in April fell from 53.3 in March to 49.8, the lowest level since 1978. Inflation expectations for one year rose from 3.8% to 4.7%, while those for a five-year term increased from 3.4% to 3.5%.
Joanne Hsu, the director of the poll, said that “The Iran conflict appears to influence consumer views primarily through shocks to gasoline and potentially other prices.”
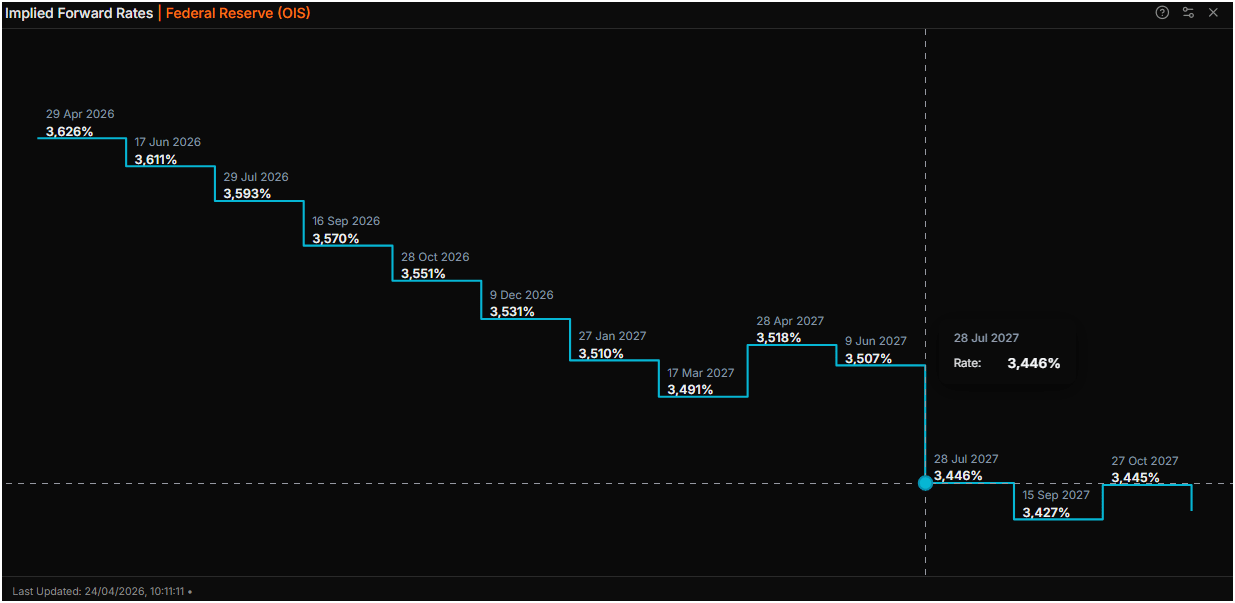
Consequently, traders do not expect the Federal Reserve (Fed) to cut rates in 2026, according to Prime Terminal data. This could put downward pressure on GBP/USD if the UK’s economy weakens further, forcing the Bank of England (BoE) to ease policy.
Fed implied forward rates
In the UK, core Retail Sales exceeded estimates, rising by 0.7% MoM in March, boosted by petrol sales, up from -0.6% in February, the Office for National Statistics (ONS) reported. Yearly, headline Retail Sales expanded by 1.7%, above forecasts but slightly below the previous print.
Next week, the US economic docket will feature the Federal Reserve’s monetary policy decision along with GDP, Durable Goods Orders, and jobs data. In the UK, traders will eye the Bank of England’s interest rate decision.
GBP/USD Price Forecast: Technical outlook
In the daily chart, GBP/USD trades at 1.3516, holding a constructive bullish tone as the spot remains above the clustered simple moving averages around 1.3411. Price also trades over the former descending trend line, whose break level near 1.2986 now underpins the broader recovery, suggesting dips are likely to find buyers while the pair stays north of the moving average support area.
On the downside, immediate support is aligned with the 1.3516 area, where the latest close and current session open converge, ahead of the triple simple moving average zone near 1.3411. A deeper pullback would eye the reclaimed descending trend-line break around 1.2986 as a more distant structural floor, while on the topside bulls would need to challenge the prior rising trend-line break region near 1.3866, which now acts as the next significant resistance cap.
(The technical analysis of this story was written with the help of an AI tool.)
(This story was corrected on April 24 at 16:43 to say that UK Retail Sales rose 0.7% MoM in March, not 0.2%.)
Pound Sterling Price This week
The table below shows the percentage change of British Pound (GBP) against listed major currencies this week. British Pound was the strongest against the Japanese Yen.
| USD | EUR | GBP | JPY | CAD | AUD | NZD | CHF | |
|---|---|---|---|---|---|---|---|---|
| USD | 0.22% | -0.19% | 0.37% | -0.07% | -0.34% | -0.26% | 0.45% | |
| EUR | -0.22% | -0.39% | 0.00% | -0.26% | -0.52% | -0.52% | 0.23% | |
| GBP | 0.19% | 0.39% | 2.17% | 0.15% | -0.13% | -0.11% | 0.63% | |
| JPY | -0.37% | 0.00% | -2.17% | -0.42% | -0.63% | -0.63% | 0.10% | |
| CAD | 0.07% | 0.26% | -0.15% | 0.42% | -0.17% | -0.21% | 0.50% | |
| AUD | 0.34% | 0.52% | 0.13% | 0.63% | 0.17% | 0.09% | 0.76% | |
| NZD | 0.26% | 0.52% | 0.11% | 0.63% | 0.21% | -0.09% | 0.70% | |
| CHF | -0.45% | -0.23% | -0.63% | -0.10% | -0.50% | -0.76% | -0.70% |
The heat map shows percentage changes of major currencies against each other. The base currency is picked from the left column, while the quote currency is picked from the top row. For example, if you pick the British Pound from the left column and move along the horizontal line to the US Dollar, the percentage change displayed in the box will represent GBP (base)/USD (quote).