Euro struggles around 1.1700 with US PPI, Trump-Xi meeting on tap
- EUR/USD picks up to levels right above 1.1700 after bouncing from 1.1695 session lows.
- The focus on Wednesday is on the US PPI and Trump's visit to China.
- Eurozone GDP and Industrial Production figures have added pressure on the Euro.
The Euro (EUR) has bounced up to levels above 1.1700 against the Dollar (USD) but remains nearly 0.6% below Tuesday's high at 1.1787, as the US Dollar is supported by hot inflation figures on Wednesday. In Europe, data released earlier on the day has failed to boost the Euro, and the focus is now on the US Producer Price Index (PPI) and the meeting between US President Donald Trump and Chinese President Xi Jinping.
US producer prices are expected to follow the path of the CPI data released on Tuesday and confirm the inflationary impact of the Middle East war. Market volatility, however, is likely to remain subdued as investors await news from the Trump-Xi meeting. The US President will try to seek support from his Chinese counterpart to solve the stalemate in Iran, and push his agenda for lower restrictions on US agricultural products and exports of rare earths. Xi, instead, might bring Taiwan's status to the table. The outcome of the meeting is likely to set the market sentiment for the end of the week.
In Europe, the second estimate of the Eurozone’s GDP confirmed that the economy grew at a meager 0.1% pace in the first three months of the year, and 0.8% in the previous 12 months, down from 0.2% and 1.3%, respectively, in Q4. Beyond that, Eurozone Industrial Production figures have shown a 0.2% growth in March, below the 0.3% market forecast, and February’s figures have been revised down to 0.2% from the previously estimated 0.4% rise. Year-on-year, factory output has accelerated its contraction, to -2.1% in March, from -0.8% in the previous month.
The US Dollar remains buoyed by the inflationary surprise revealed by April’s Consumer Price Index (CPI) figures released on Tuesday. A nearly three-year high year-on-year CPI rate has crushed hopes of further Federal Reserve (Fed) rate cuts in the foreseeable future, boosting US Treasury yields and the Greenback with them.
Technical Analysis: Approaching key support below 1.1675
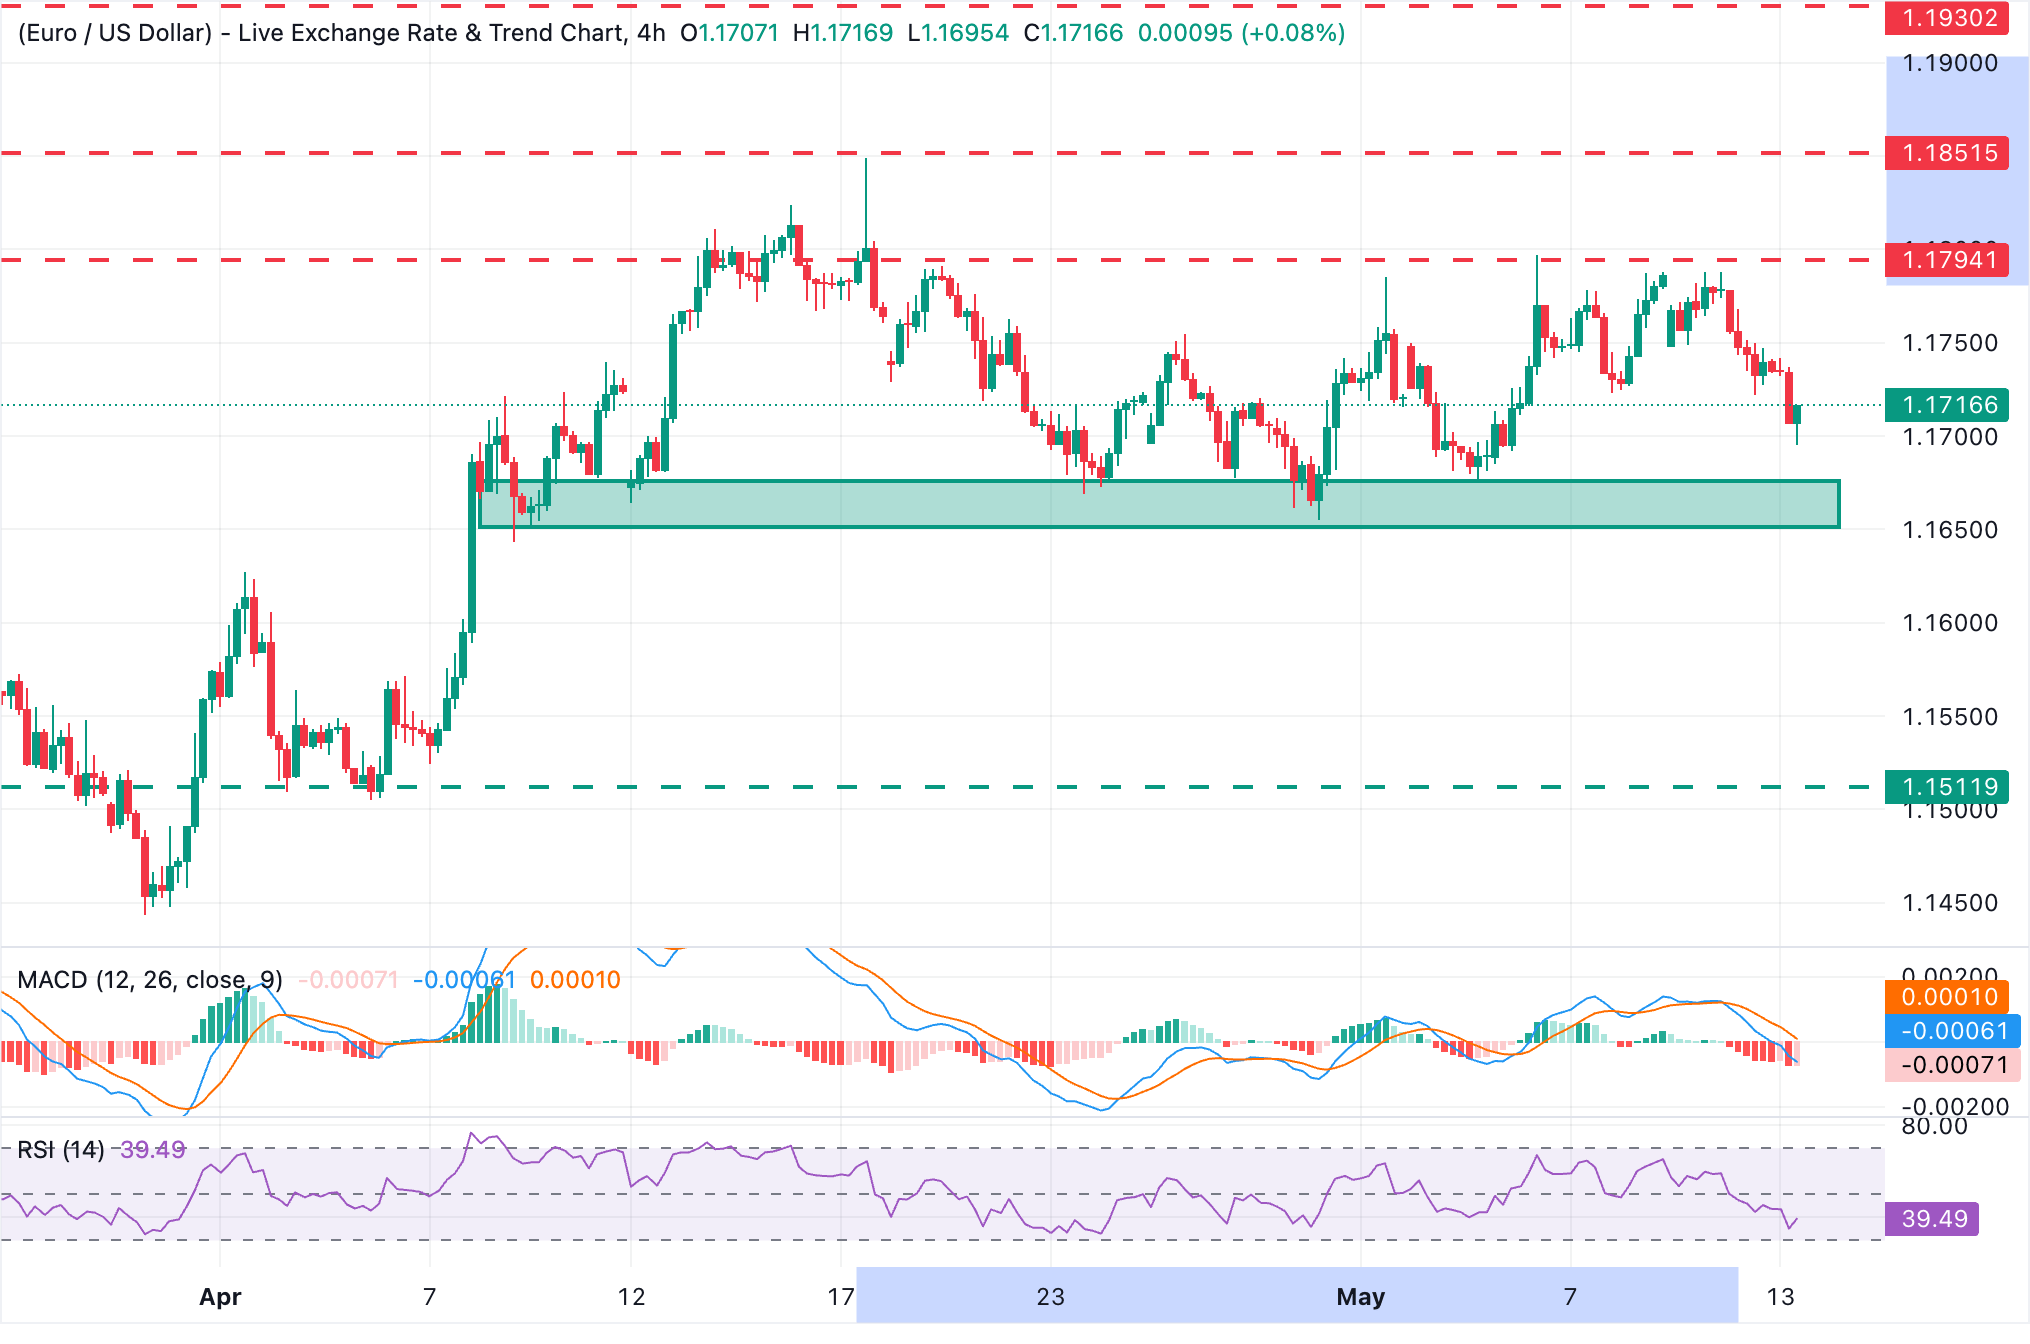
EUR/USD shows a growing bearish tone in 4-hour charts, with momentum indicators reinforcing the downside bias. The Relative Strength Index (RSI) has bounced from levels close to oversold territory but remains below 50, and the Moving Average Convergence Divergence (MACD) histogram is slipping further into negative territory, suggesting persistent selling pressure.
Bears have gained momentum after breaching weekly lows near 1.1720 and are heading to a key support area between 1.1645 and 1.1675, which contained downside attempts several times in April. A confirmation below those levels would bring April's bottom, near 1.1510, into focus.
On the topside, the intra-day highs, near 1.1740, are likely to offer resistance to a potential bullish reaction, ahead of the May 6, 8, and 11 highs above 1.1790 and the April 17 high, at 1.1851.
(The technical analysis of this story was written with the help of an AI tool.)
Economic Indicator
Producer Price Index (MoM)
The Producer Price Index released by the Bureau of Labor statistics, Department of Labor measures the average changes in prices in primary markets of the US by producers of commodities in all states of processing. Changes in the PPI are widely followed as an indicator of commodity inflation. Generally speaking, a high reading is seen as positive (or bullish) for the USD, whereas a low reading is seen as negative (or bearish).
Read more.Next release: Wed May 13, 2026 12:30
Frequency: Monthly
Consensus: 0.5%
Previous: 0.5%
Source: US Bureau of Labor Statistics
Economic Indicator
Producer Price Index (YoY)
The Producer Price Index released by the Bureau of Labor statistics, Department of Labor measures the average changes in prices in primary markets of the US by producers of commodities in all states of processing. Changes in the PPI are widely followed as an indicator of commodity inflation. Generally speaking, a high reading is seen as positive (or bullish) for the USD, whereas a low reading is seen as negative (or bearish).
Read more.Next release: Wed May 13, 2026 12:30
Frequency: Monthly
Consensus: 4.9%
Previous: 4%
Source: US Bureau of Labor Statistics