AUD/USD Price Forecast: Flat 20-day EMA indicates sideways trend
- AUD/USD consolidates around 0.7175 while investors seek fresh updates on US-Iran negotiations.
- Iran warns that the Israel-Lebanon conflicts and US naval blockade are evidence of US noncompliance with the ceasefire.
- Australian Q1 GDP data is expected to arrive at 0.5%.
The AUD/USD pair trades in a tight range around 0.7175 during the European trading session on Monday. The Aussie pair consolidates as uncertainty regarding the United States (US)-Iran negotiations toward a permanent peace deal has escalated.
Financial market participants have turned slightly cautious towards the US-Iran peace deal finalization, following amendments from US President Donald Trump in the potential deal. Trump said in an interview with Fox News over the weekend that neither he wants Iran to develop nuclear weapons nor to purchase them. Trump added that negotiations with Iran remain ongoing and Washington is in no rush for a deal.
Meanwhile, the exchange of attacks between Israel and Lebanon has also raised concerns over the likelihood of an early deal.
During the day, Iran’s Parliament Speaker Mohammad Bagher Ghalibaf has warned through a post on X that the United States (US) naval blockade on Iranian sea ports and Israeli attacks on Lebanon are clear evidence of US noncompliance with the ceasefire.
On the domestic front, investors await the Q1 Gross Domestic Product (GDP) data, which will be released on Wednesday. The Q1 Australian GDP data is expected to arrive lower at 0.5% from the previous reading of 0.8%.
AUD/USD technical analysis
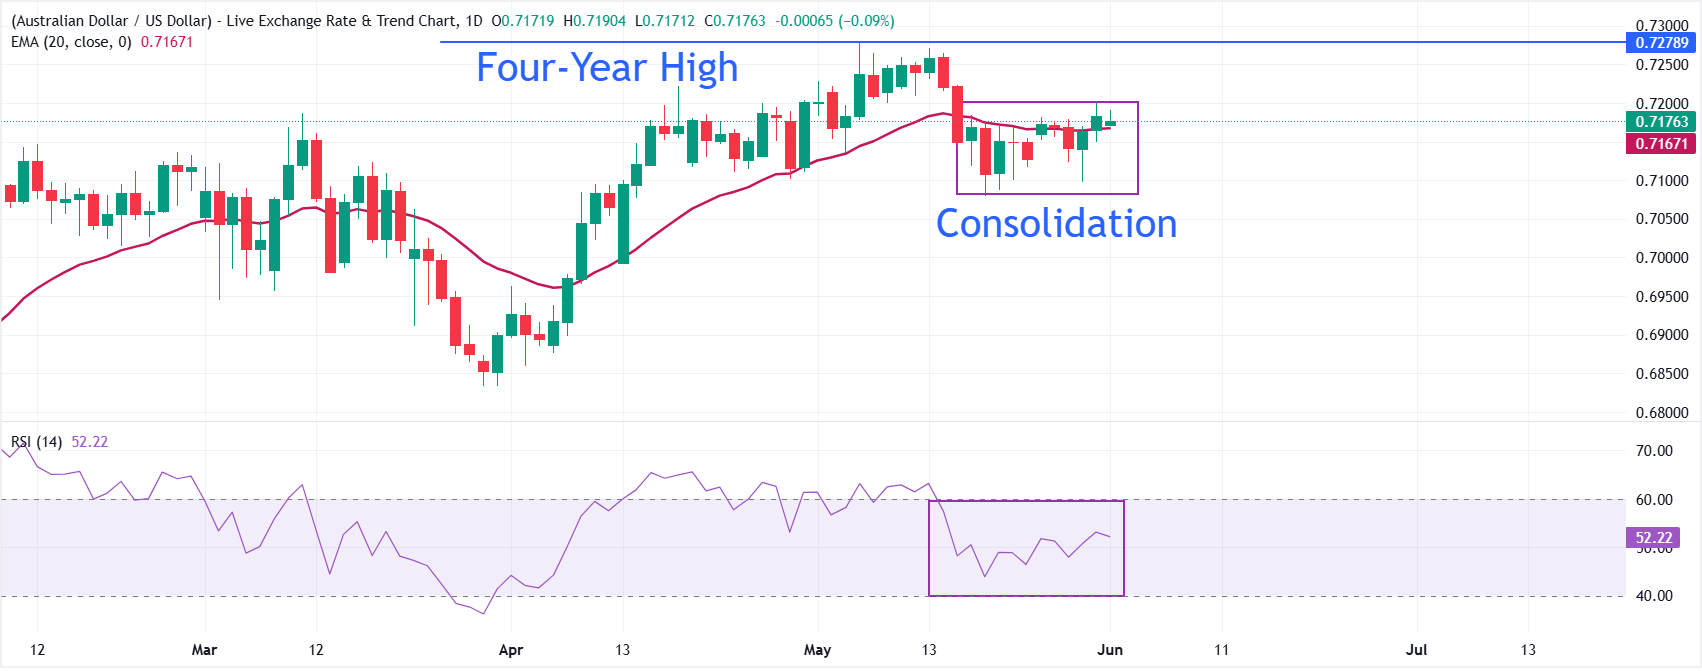
AUD/USD trades flat at around 0.7176 as of writing. The Aussie pair has been consolidating for over two weeks in a tight range between 0.7080 and 0.7200. The sideways 20-period exponential moving average (EMA) at 0.7167 also indicates indecisiveness among investors.
The Relative Strength Index (RSI) near 52 is close to neutral, hinting at a sharp volatility contraction.
On the downside, 0.7150 is the immediate support, with a break below could expose the pair to the May 19 low at 0.7080. Looking up, the pair could aim to revisit the four-year high at 0.7277 if it manages to break above the May 29 high at 0.7200.
(The technical analysis of this story was written with the help of an AI tool.)
Economic Indicator
Gross Domestic Product (QoQ)
The Gross Domestic Product (GDP), released by the Australian Bureau of Statistics on a quarterly basis, is a measure of the total value of all goods and services produced in Australia during a given period. The GDP is considered as the main measure of Australian economic activity. The QoQ reading compares economic activity in the reference quarter to the previous quarter. Generally, a rise in this indicator is bullish for the Australian Dollar (AUD), while a low reading is seen as bearish.
Read more.Next release: Wed Jun 03, 2026 01:30
Frequency: Quarterly
Consensus: 0.5%
Previous: 0.8%
Source: Australian Bureau of Statistics
The Australian Bureau of Statistics (ABS) releases the Gross Domestic Product (GDP) on a quarterly basis. It is published about 65 days after the quarter ends. The indicator is closely watched, as it paints an important picture for the economy. A strong labor market, rising wages and rising private capital expenditure data are critical for the country’s improved economic performance, which in turn impacts the Reserve Bank of Australia’s (RBA) monetary policy decision and the Australian dollar. Actual figures beating estimates is considered AUD bullish, as it could prompt the RBA to tighten its monetary policy.