USD/INR slides vertically as US-India trade deal strengthens Indian Rupee
- The Indian Rupee rallies against the US Dollar, following the trade deal announcement by the US and India.
- The US slashes tariffs on India to 18% in exchange for zero import duty on goods from Washington.
- Investors await the RBI’s monetary policy and the US NFP data for January.
The Indian Rupee (INR) gains sharply against the US Dollar (USD) on Tuesday, following the confirmation of a long-awaited trade deal between the United States (US) and India the previous day. The USD/INR pair opens with a gap down to near 90.35, the lowest level seen in almost three weeks.
On Monday, US President Donald Trump confirmed a bilateral trade pact with India in which Washington slashed tariffs on imports from New Delhi to 18% from 50%, which is lower than or equal to most economies in South Asia and the Association of South-East Asian Nations (ASEAN). This scenario will be favorable for Indian exporters to get a competitive edge over their competitors in other Asian nations.
In exchange, the Indian economy agreed to reduce tariffs on imports from Washington to zero, no oil purchase from Russia, and commit to buying several American goods, including energy, agriculture, coal, and technology, worth $500 billion.
The US-India trade deal euphoria has resulted in a significant upside move in the Indian stock market. The Nifty50 opens almost 3.5% higher to near 26,330, led by a strong jump in technology, gems and jewelry, textile, and capital market stocks.
The table below shows the percentage change of Indian Rupee (INR) against listed major currencies today. Indian Rupee was the strongest against the Canadian Dollar.
| USD | EUR | GBP | JPY | CAD | AUD | INR | CHF | |
|---|---|---|---|---|---|---|---|---|
| USD | -0.20% | -0.23% | -0.11% | -0.10% | -0.96% | 0.04% | -0.25% | |
| EUR | 0.20% | -0.02% | 0.09% | 0.10% | -0.75% | -0.71% | -0.04% | |
| GBP | 0.23% | 0.02% | 0.13% | 0.13% | -0.73% | 0.27% | -0.02% | |
| JPY | 0.11% | -0.09% | -0.13% | 0.03% | -0.83% | -0.78% | -0.12% | |
| CAD | 0.10% | -0.10% | -0.13% | -0.03% | -0.85% | -0.83% | -0.14% | |
| AUD | 0.96% | 0.75% | 0.73% | 0.83% | 0.85% | 0.04% | 0.72% | |
| INR | -0.04% | 0.71% | -0.27% | 0.78% | 0.83% | -0.04% | 0.67% | |
| CHF | 0.25% | 0.04% | 0.02% | 0.12% | 0.14% | -0.72% | -0.67% |
The heat map shows percentage changes of major currencies against each other. The base currency is picked from the left column, while the quote currency is picked from the top row. For example, if you pick the Indian Rupee from the left column and move along the horizontal line to the US Dollar, the percentage change displayed in the box will represent INR (base)/USD (quote).
Daily Digest Market Movers: US partial federal shutdown restricts US Dollar's advance
- The US Dollar ticks lower after a strong upside move in the last two trading days, with investors shifting focus to an array of US economic data releases this week.
- As of writing, the US Dollar Index (DXY), which tracks the Greenback’s value against six major currencies, trades 0.1% lower to near 97.53.
- The US Dollar has retraced slightly due to the partial US federal shutdown, which will suspend key economic data releases.
- On Monday, the US ISM Manufacturing PMI report for January showed that the manufacturing sector activity returned to growth after declining for several months. The Manufacturing PMI came in at 52.6, higher than estimates of 48.5 and the prior release of 47.9. A figure above 50.00 is seen as an expansion in the business activity.
- The US Dollar has been outperforming since Friday after US President Donald Trump nominated former Governor Kevin Warsh for the Fed’s new Chairman. Investors expected Warsh to avoid rapid interest rate cuts, given his historic preference for a firmer US Dollar in his previous tenure at the Fed.
- This week, the major trigger for the Indian Rupee will be the monetary policy announcement by the Reserve Bank of India (RBI) on Friday.
Technical Analysis: USD/INR settles below 20-day EMA
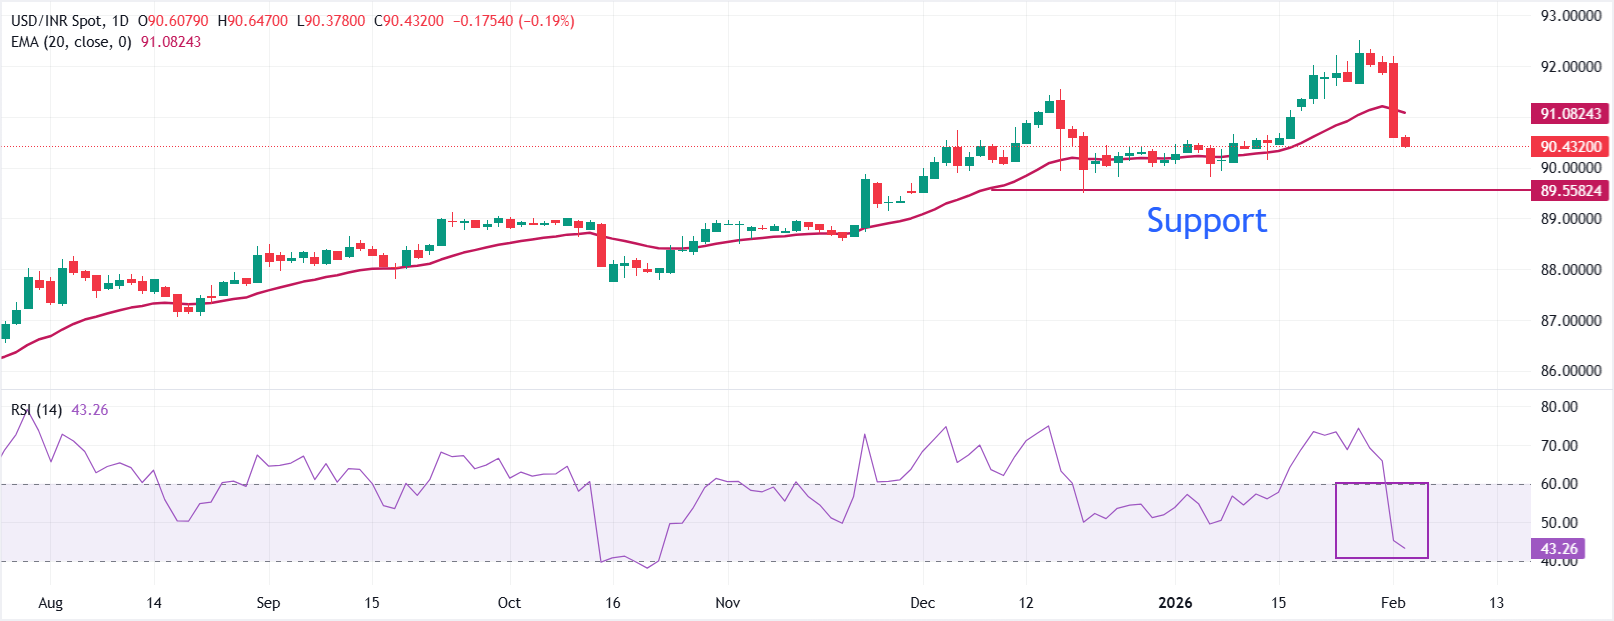
USD/INR trades sharply lower to near 90.35 as of writing. The price slides below the 20-day Exponential Moving Average (EMA) at 91.0816, keeping the near-term bias soft. The 20-day EMA has started to roll over, reinforcing a corrective tone. Rallies could be capped at the EMA.
The 14-day Relative Strength Index (RSI) at 43.17 is below the 50 midline, confirming waning momentum.
Unless USD/INR reclaims the 20-day EMA on a closing basis, the risk stays skewed toward further range compression or downside probes. Looking down, the pair could find support near the December 19 low of 89.50
(The technical analysis of this story was written with the help of an AI tool.)