Gold eases slightly from fresh record highs above $4,500
- Gold consolidates below record highs as thin holiday liquidity triggers mild profit-taking.
- Safe-haven demand, Fed easing expectations and a softer US Dollar continue to underpin the broader bullish bias.
- Technically, a bearish RSI divergence warns of near-term consolidation, though the uptrend remains intact.
Gold (XAU/USD) treads water on Wednesday, with prices consolidating after surging to a fresh all-time high near $4,526 earlier today. Volatility picked up during the Asian session amid thin holiday liquidity ahead of Christmas, encouraging mild profit-taking at elevated levels. At the time of writing, XAU/USD trades around $4,487, up over 3.0% this week.
Bullion’s historic rally this year has been nothing short of remarkable, with prices up more than 70% year to date, putting Gold on track for its strongest annual performance since 1979. The rally has been driven by strong safe-haven demand amid persistent geopolitical risks and economic uncertainties, as well as robust institutional and investment flows.
Another major driver behind Gold’s historic run has been broad weakness in the US Dollar (USD), driven by US President Donald Trump’s protectionist trade rhetoric and easing monetary policy by the Federal Reserve (Fed).
The Fed delivered a cumulative 75 basis points (bps) of rate cuts in 2025. Markets are also pricing in two additional rate cuts next year. This environment has continued to support demand for the precious metal as lower interest rates reduce the opportunity cost of holding non-yielding assets such as Gold.
Looking ahead, Gold may consolidate in the near term, as a lack of fresh market catalysts and further profit-taking ahead of the year-end could exert some downward pressure on prices. That said, the broader uptrend remains firmly intact, suggesting the rally is likely to continue into 2026.
Market movers: Fed outlook and geopolitics keep Gold supported
- Markets digested the final batch of key economic data ahead of the holiday period on Tuesday. The US Bureau of Economic Analysis released the preliminary estimate of third-quarter Gross Domestic Product (GDP), which had been delayed by the recent government shutdown. The report showed the US economy expanded at an annualized pace of 4.3% in Q3, beating both the prior estimate of 3.8% and the market expectation of 3.3%.
- The upbeat GDP figures contrasted with softer US data elsewhere. Durable Goods Orders fell 2.2% in October, while Industrial Production slipped 0.1% month-on-month in October before rebounding 0.2% in November. Meanwhile, Conference Board Consumer Confidence dropped to 89.1 in December, from an upwardly revised 92.9 in November, keeping the US Dollar on the back foot.
- The US Dollar Index (DXY), which tracks the Greenback's value against a basket of six major currencies, trades around 97.87, hovering near its lowest level since October 3.
- On the monetary policy front, markets broadly expect the Fed to keep rates unchanged at its January meeting. Chair Jerome Powell said in December that the Fed is “well positioned to wait and see how the economy evolves.” The CME FedWatch Tool shows just a 13% probability of a rate cut in January. Still, investors expect the central bank to return to easing later in the year, amid signs of cooling inflation and a weakening labour market.
- Geopolitical tensions remain elevated, with the ongoing Russia-Ukraine conflict, persistent instability in the Middle East, and rising tensions between the United States and Venezuela continuing to weigh on market sentiment.
Technical analysis: Bearish RSI divergence raises correction risk
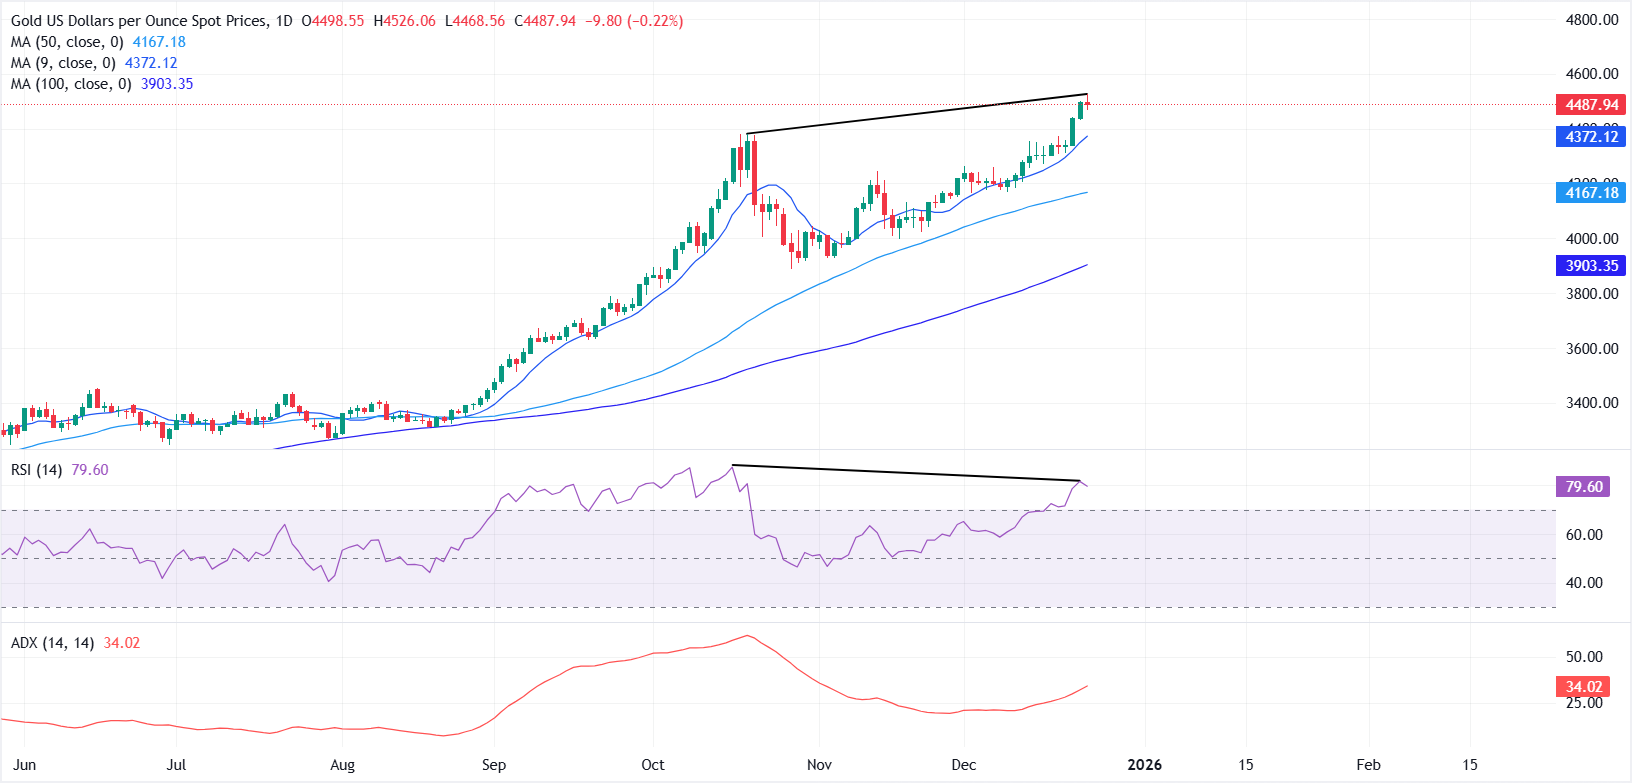
On the daily chart, XAU/USD is navigating uncharted territory, though risks of a mild pullback are starting to build. Momentum indicators suggest the rally is becoming overstretched, with the Relative Strength Index (RSI) hovering near overbought territory and showing early signs of fatigue, while a bearish divergence is beginning to take shape.
The broader bullish structure remains firmly intact, as prices continue to trade well above key moving averages. On the downside, the previous all-time high near $4,381 could act as the first line of defence, followed by the 9-day Simple Moving Average (SMA) around $4,372.
A decisive break below this short-term average could expose the 50-day SMA near $4,167, where buyers are likely to re-emerge.
On the upside, the $4,500 psychological level stands as an immediate resistance, ahead of a potential retest of the fresh all-time high at $4,526. A sustained break above this zone could open the door for further gains toward the $4,600 handle.
Meanwhile, the Average Directional Index (ADX) is rising and sits above the 30 mark, signalling that the underlying trend strength remains strong, even as momentum cools in the near term.
Gold FAQs
Gold has played a key role in human’s history as it has been widely used as a store of value and medium of exchange. Currently, apart from its shine and usage for jewelry, the precious metal is widely seen as a safe-haven asset, meaning that it is considered a good investment during turbulent times. Gold is also widely seen as a hedge against inflation and against depreciating currencies as it doesn’t rely on any specific issuer or government.
Central banks are the biggest Gold holders. In their aim to support their currencies in turbulent times, central banks tend to diversify their reserves and buy Gold to improve the perceived strength of the economy and the currency. High Gold reserves can be a source of trust for a country’s solvency. Central banks added 1,136 tonnes of Gold worth around $70 billion to their reserves in 2022, according to data from the World Gold Council. This is the highest yearly purchase since records began. Central banks from emerging economies such as China, India and Turkey are quickly increasing their Gold reserves.
Gold has an inverse correlation with the US Dollar and US Treasuries, which are both major reserve and safe-haven assets. When the Dollar depreciates, Gold tends to rise, enabling investors and central banks to diversify their assets in turbulent times. Gold is also inversely correlated with risk assets. A rally in the stock market tends to weaken Gold price, while sell-offs in riskier markets tend to favor the precious metal.
The price can move due to a wide range of factors. Geopolitical instability or fears of a deep recession can quickly make Gold price escalate due to its safe-haven status. As a yield-less asset, Gold tends to rise with lower interest rates, while higher cost of money usually weighs down on the yellow metal. Still, most moves depend on how the US Dollar (USD) behaves as the asset is priced in dollars (XAU/USD). A strong Dollar tends to keep the price of Gold controlled, whereas a weaker Dollar is likely to push Gold prices up.