EUR/USD treads water awaiting US manufacturing activity data
- EUR/USD consolidates losses around 1.1850 after dropping by over 1% on Friday.
- Eurozone and German HCOB manufacturing PMIs have been upwardly revised.
- The US Dollar remains supported by the nomination of Kevin Warsh as the next Fed Chair.
The Euro (EUR) has turned negative against the US Dollar (USD) on Monday, and is trading at 1.1845 at the time of writing, despite rather positive data from the Eurozone. The Dollar holds its ground, supported by the nomination of Kevin Warsh as the next Federal Reserve (Fed) Chair, while a risk-averse market sentiment is weighing on the Euro.
Investors showed some relief after US President Donald Trump confirmed on Friday that Kevin Warsh will replace Jerome Powell as Fed Chairman when his term expires in May. Warsh is partidary of a smaller balance sheet and has advocated for lower borrowing costs in recent times, although he is expected to take a cautious approach to inflation.
In Europe, the final HCOB Manufacturing PMI readings revealed that the sector's activity improved beyond expectations in January. The Eurozone PMI has been revised up to 49.5, from previous estimations of 49.4, and also above December's 48.8 reading. In a similar line, German PMI has been revised up to 49.1. Preliminary estimations had shown a 48.7 reading, unchanged from the previous month.
The focus now will be on the US Manufacturing Purchasing Managers' Indexes (PMI) due later today. Investors, however, are likely to remain cautious ahead of a busy economic calendar this week, which includes the Eurozone Central Bank's (ECB) monetary policy decision on Thursday and the key US Nonfarm Payrolls (NFP) report on Friday, among other relevant releases.
Euro Price Today
The table below shows the percentage change of Euro (EUR) against listed major currencies today. Euro was the strongest against the Swiss Franc.
| USD | EUR | GBP | JPY | CAD | AUD | NZD | CHF | |
|---|---|---|---|---|---|---|---|---|
| USD | 0.05% | -0.05% | 0.15% | 0.15% | 0.15% | 0.12% | 0.43% | |
| EUR | -0.05% | -0.09% | 0.09% | 0.11% | 0.10% | 0.08% | 0.38% | |
| GBP | 0.05% | 0.09% | 0.19% | 0.21% | 0.20% | 0.17% | 0.48% | |
| JPY | -0.15% | -0.09% | -0.19% | 0.02% | 0.01% | -0.02% | 0.29% | |
| CAD | -0.15% | -0.11% | -0.21% | -0.02% | -0.01% | -0.04% | 0.27% | |
| AUD | -0.15% | -0.10% | -0.20% | -0.01% | 0.00% | -0.03% | 0.28% | |
| NZD | -0.12% | -0.08% | -0.17% | 0.02% | 0.04% | 0.03% | 0.31% | |
| CHF | -0.43% | -0.38% | -0.48% | -0.29% | -0.27% | -0.28% | -0.31% |
The heat map shows percentage changes of major currencies against each other. The base currency is picked from the left column, while the quote currency is picked from the top row. For example, if you pick the Euro from the left column and move along the horizontal line to the US Dollar, the percentage change displayed in the box will represent EUR (base)/USD (quote).
Daily Digest market Movers: The Dollar remains supported by Warsh's nomination
- The market has reacted positively to the nomination of Kevin Warsh as the next Fed Chief. The market is forecasting at least two rate cuts in 2026, according to data from the CME Group's Fed Watch Tool, but Warsh has already served as a Fed Governor, and he was sensitive to inflation risks during his tenure.
- German Retail Sales have shown a 0.1% growth in December, following a 0.5% decline in November and beating the market consensus that had anticipated a 0.2% drop. Year-on-year, German retail consumption accelerated by 1.5%, from 1.3% in the previous month. The impact of the data on the Euro has been minor.
- In the US, January's ISM Manufacturing PMI is expected to show a moderate improvement to 48.3 from 47.9 in December, with prices paid accelerating to a four-month high of 60.5.
- Later on, Atlanta Fed President Raphael Bostic will take the stage. Bostic has been reluctant to cut interest rates and recently affirmed that the balance sheet is "about right" last week, which brings to light the divergences within the central bank's committee.
Technical Analysis: EUR/USD hovers above 1.1835 with bears in control
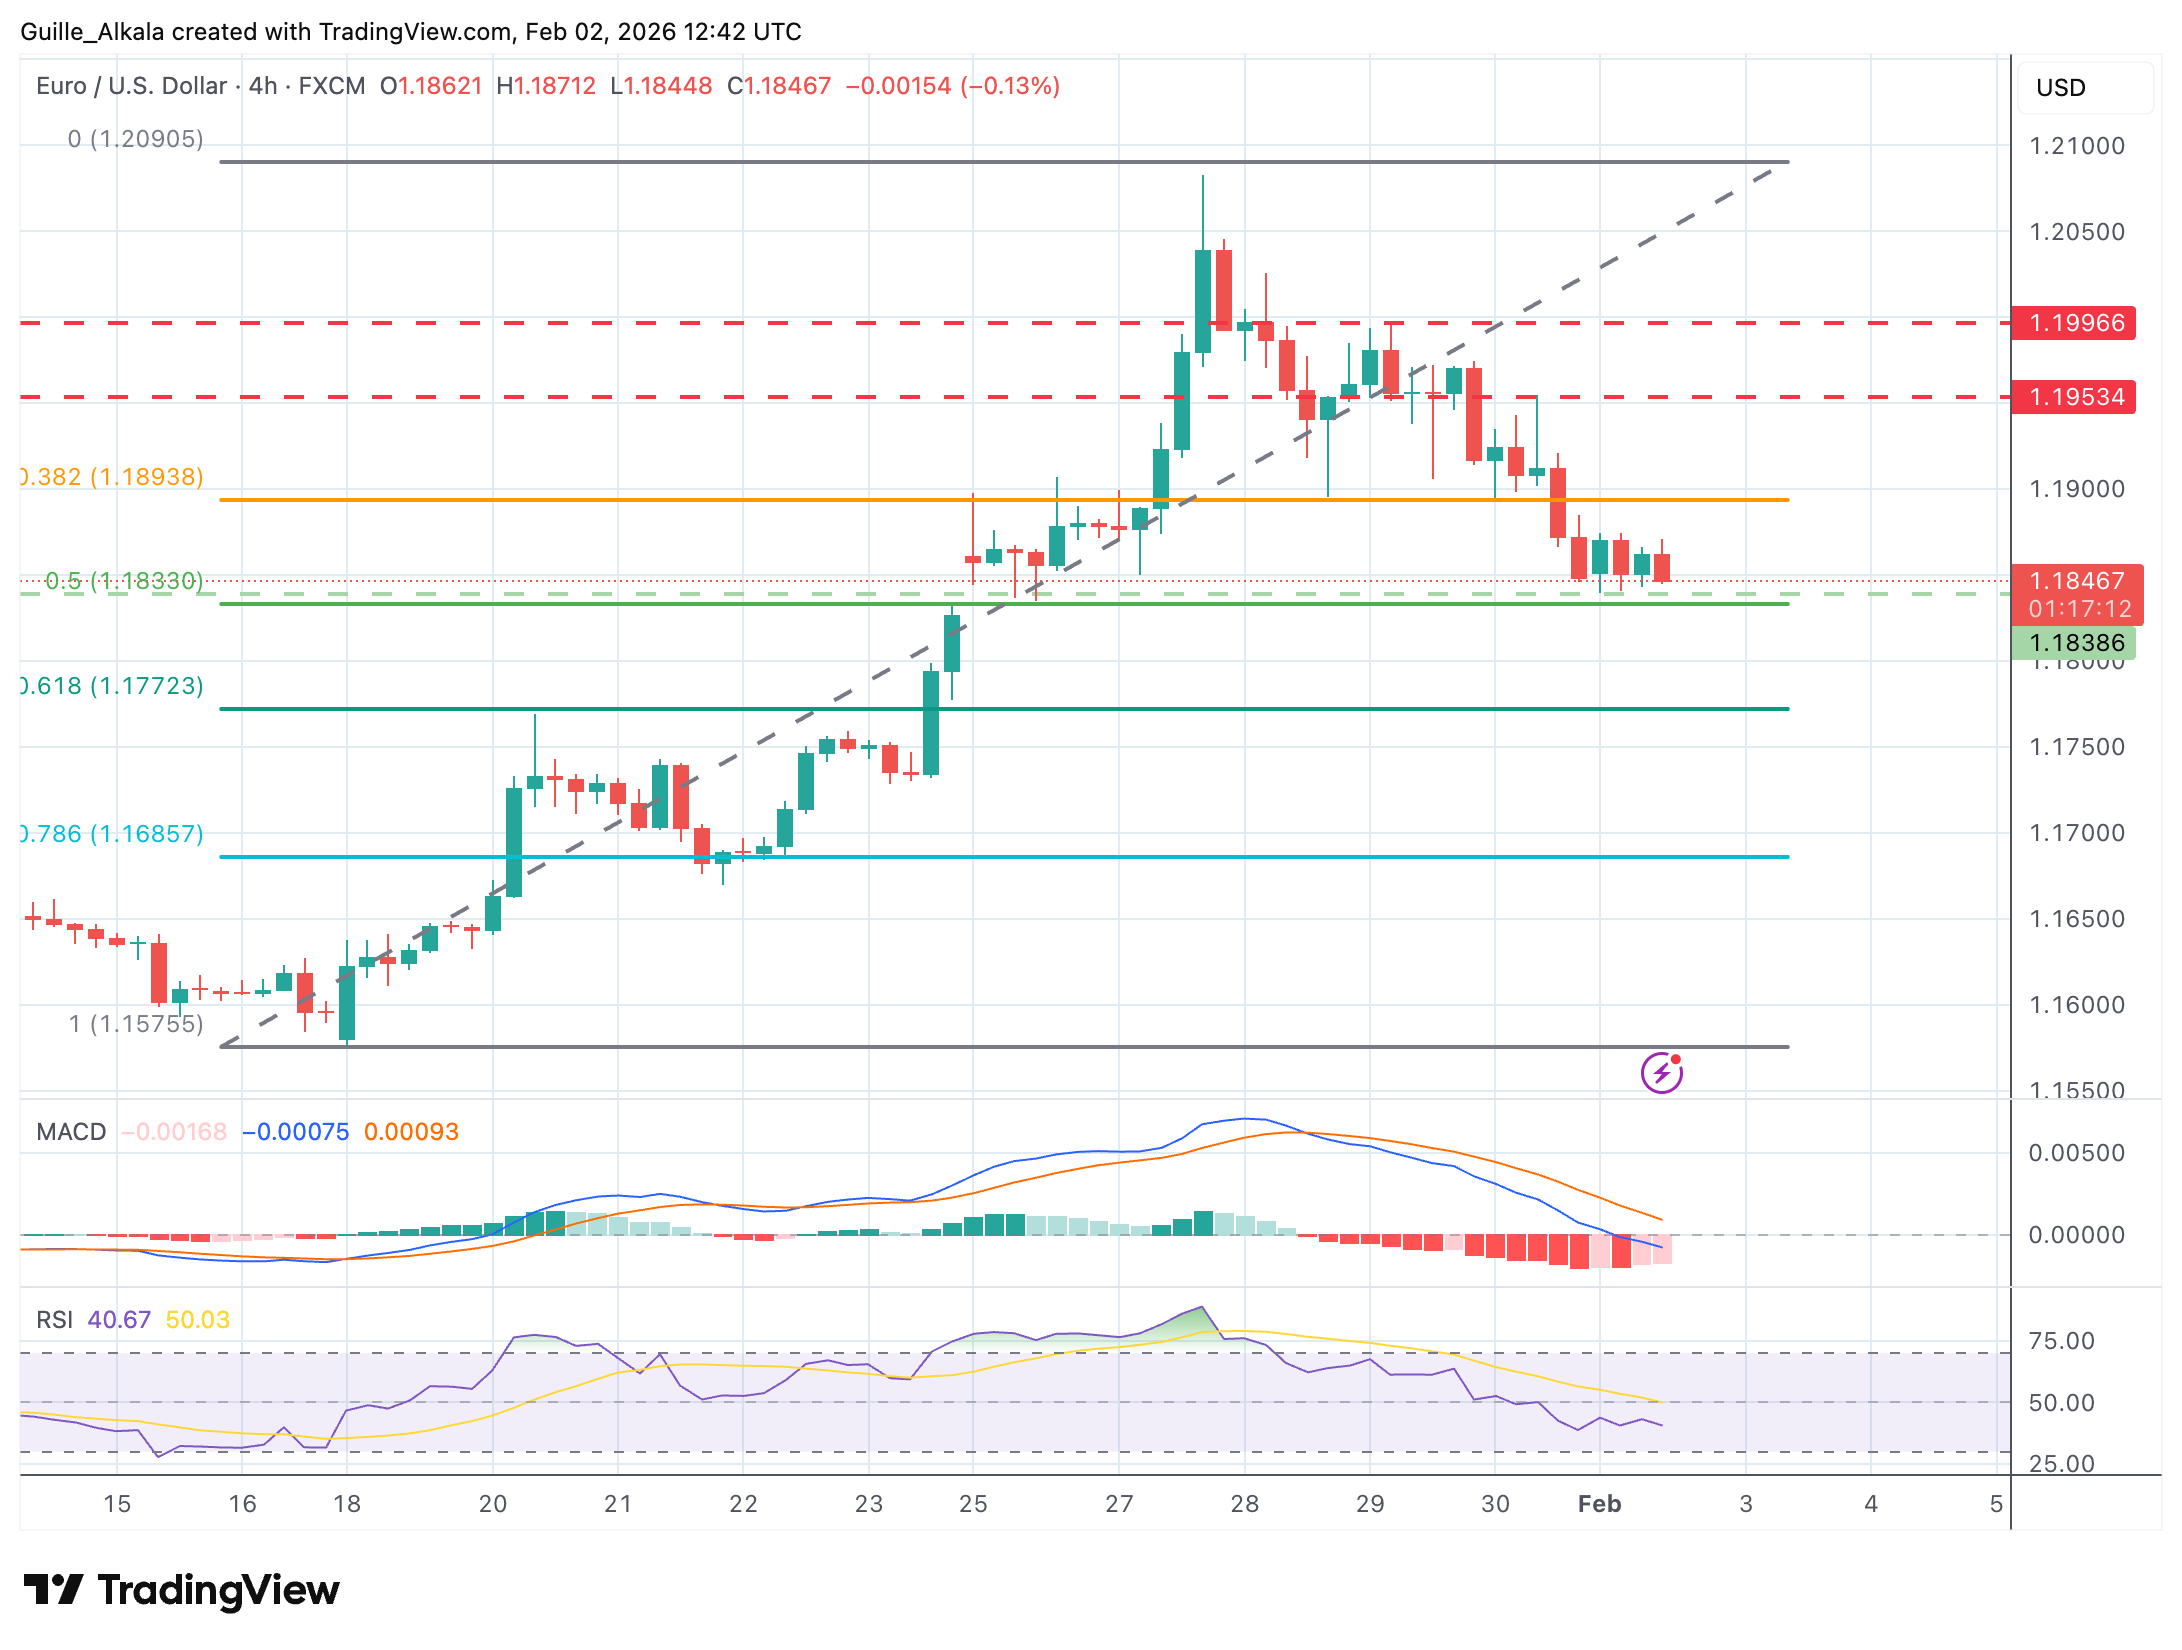
The EUR/USD is on a bearish correction, hovering near 1.1850 after pulling back from four-year highs near 1.2100. Technical indicators are pointing lower on the 4-hour chart. The Relative Strength Index (RSI) has dropped below the key 50 level, and the Moving Average Convergence Divergence (MACD) histogram shows expanding negative bars.
The pair has found some footing above the January 26 low, at the 1.1835 area, and the 50% Fibonacci retracement of the late-January rally, at 1.1830. Further down, the target is the 61.8% Fibonnaci retracement of the mentioned cycle, at the 1.1770 area.
Upside attempts are likely to be challenged at Friday's high, near 1.1955, ahead of the round 1.2000 level.
Economic Indicator
ISM Manufacturing PMI
The Institute for Supply Management (ISM) Manufacturing Purchasing Managers Index (PMI), released on a monthly basis, is a leading indicator gauging business activity in the US manufacturing sector. The indicator is obtained from a survey of manufacturing supply executives based on information they have collected within their respective organizations. Survey responses reflect the change, if any, in the current month compared to the previous month. A reading above 50 indicates that the manufacturing economy is generally expanding, a bullish sign for the US Dollar (USD). A reading below 50 signals that factory activity is generally declining, which is seen as bearish for USD.
Read more.Next release: Mon Feb 02, 2026 15:00
Frequency: Monthly
Consensus: 48.5
Previous: 47.9
Source: Institute for Supply Management
The Institute for Supply Management’s (ISM) Manufacturing Purchasing Managers Index (PMI) provides a reliable outlook on the state of the US manufacturing sector. A reading above 50 suggests that the business activity expanded during the survey period and vice versa. PMIs are considered to be leading indicators and could signal a shift in the economic cycle. Stronger-than-expected prints usually have a positive impact on the USD. In addition to the headline PMI, the Employment Index and the Prices Paid Index numbers are watched closely as they shine a light on the labour market and inflation.
Economic Indicator
ISM Manufacturing Prices Paid
The Institute for Supply Management (ISM) Manufacturing Index shows business conditions in the US manufacturing sector, taking into account expectations for future production, new orders, inventories, employment and deliveries. It is a significant indicator of the overall economic condition in US. The ISM Prices Paid represents business sentiment regarding future inflation. A high reading is seen as positive for the USD, while a low reading is seen as negative.
Read more.Next release: Mon Feb 02, 2026 15:00
Frequency: Monthly
Consensus: 60.5
Previous: 58.5
Source: Institute for Supply Management